Get to know the project in 3 facts

  • Open question at the forefront of the client’s interests: which BI tool can replace the current reporting system, providing more flexibility and user-friendliness?
  • BI criteria matrix: produced by Oxagile’s BI expert to make the top choice among the BI tools considered
  • Oxagile’s role: analyzing functional and non-functional requirements to the BI system, optimal BI tool selection, PoC implementation, and MVP launch

What was the client concerned about from the very start?

“When you’re a loan servicing company, data management and representation to external users and our employees in an easy and structured way comes to the fore.

While our reporting system more or less copes with basic data modeling requirements, any alteration inevitably dictates the involvement of development specialists.

Besides, quite trivial tables and buttons leave users cold and need to be replaced by visually appealing dashboard elements.

Craving for better flexibility and user-friendliness, our team has a vague idea of which BI tool – Tableau, Looker, or another option – might work for us best.”

Dmitry, Lead BI Engineer, Oxagile:

“Instead of intuitive judgements, we brought all the requirements
together in a BI criteria matrix to make a well-informed decision.”

What did a client have in their arsenal? A custom reporting system having some gaps in the ease of visualization and a lack of must-have functionality.

What’s missing? An understanding of what tools are capable of replacing their current solution and how to define best of the best.

Where did we start from? A thorough analysis of their in-house solution, which let us accumulate a set of criteria to further evaluate the nominees for the most suitable BI option.

“For making the evaluation process easy, consistent, and transparent, our team introduced a BI criteria matrix. This is the document where all functional and non-functional requirements are gathered and prioritized (either those already implemented in the client’s current system or the ones that were missing), while each of the four tools included in the list is evaluated for compliance with all these categories.

— Dmitry, BI Engineer

1 Solution Architect

With extensive experience in a relevant tool stack 

3 BI Engineers

Providing BI development services

1 Business Analyst

Describing business logic of dashboards, KPIs, metrics, etc. and preparing technical documentation for the development team

2 QA Specialists

Preventing mistakes in the reporting process

1 Project Manager

Responsible for process organization

1 Delivery Manager

In charge of the overall quality of service delivery

1 UX/UI Designer

Preparing the design of future dashboards

The project was carried out in a close collaboration between our team and stakeholders from the customer’s side, including an architect, product owners, and data engineers.

What was going on during the Discovery phase?

Collection and analysis of requirements

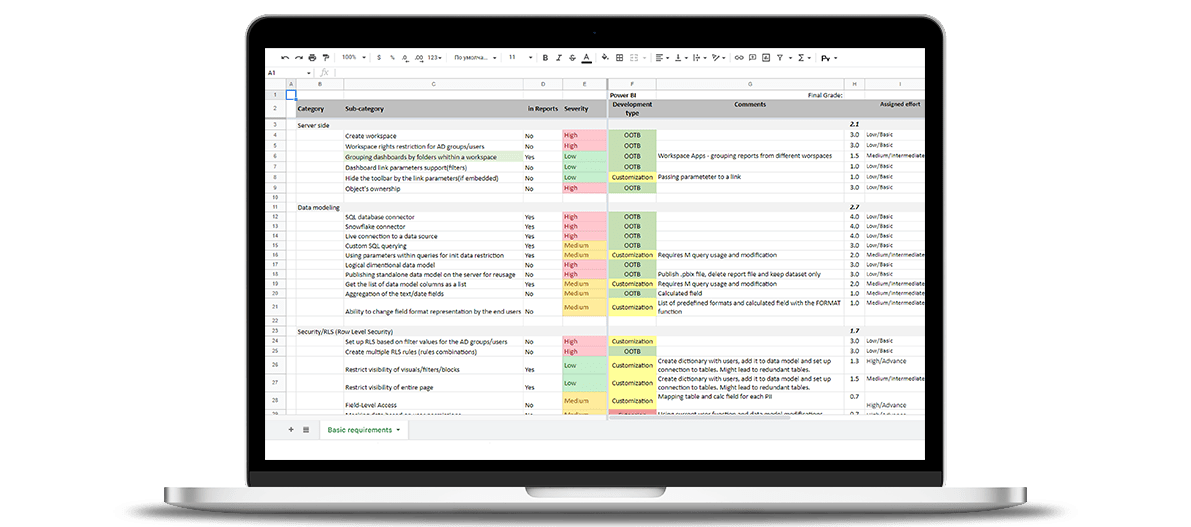
First, Oxagile’s team accumulated all obligatory functions that should be transferred from the existing BI solution to the newly-made one.

Then, our experts made up the list of additional wants and needs, like bookmarking (create / apply / share), data export in different formats including pdf, csv, and excel, a report builder, interactive profile cards, custom visualizations, data modelling, etc.

Among the other tasks are:

  • Defining whether a new BI solution will be embedded into another app or become a standalone service
  • Specifying system capacity: a number of users and concurrent users, data volume, etc.
  • Checking data source readiness and a data warehouse structure

Matrix creation

On top of arranging and storing the list of requirements together in one place, the BI criteria matrix makes it easy to:

  • Prioritize the requirements
    The severity mark impacts the final choice of the BI tool as it emphasizes the must-have functions that a tool is expected to provide.
  • Predict growing costs and extra efforts on development
    Each category is labeled as “out-of-the-box”, “customization”, and “extension” to answer a question whether or not BI tools are ready to deal with the requirements without additional assistance.

Matrix presentation and review by the client

After introducing our vision of the whole set of criteria a new BI tool should respond to and announcing the solution that left other BI candidates behind, we finalized the selection of the data visualization software product.

Moving to PoC: our contribution

Nuts and bolts of PoC development

  • Our key task during this stage: the creation of a couple of extensive and the most popular dashboards on the BI tool chosen.
  • Data for visualization: our BI team was provided with a backup of the client’s database. This helped us reproduce the functionality of their existing system by using real data.

Scope of the requirements

  • Covering all features available in the client’s current BI system
  • Embedding the dashboard in the client’s web application (single point of entry)
  • Supporting row-level and column-level security
  • Data export and printing capabilities, bookmarking and sharing options, etc.

Right after the PoC implementation was completed, we conducted functional testing and load testing to find and eliminate performance bottlenecks with concurrent system users. The customer was provided with a comprehensive test report.

Result: As the client was satisfied with the system’s demo, the project moved further to the MVP phase where all the requirements were implemented.

What’s the business value?

No more functionality gaps, rigid reporting rules, and limited visualization capabilities — instead, our client discovered that the careful choice and customization of a BI tool guarantees a user-friendly self-service reporting system providing actionable dashboards in a few clicks. Now the customer is getting immediate insights with real-time data for operational decision making and further business growth.