Why EdTech may fail without analytics

Even outstanding EdTech functionality and learner experiences may be unsuccessful if the implementation isn’t data-driven. Be sure you don’t face these common issues caused by the absence of in-built EdTech analytics.

Unresolved learning product gaps

You might think that you know exactly how to engage and retain students with your learning scenarios and tools, but something went wrong, right? Might a lack of product analytics be the reason?

Unproductive learning experience

Do you sometimes have difficulties with establishing personalized learning paths? What if insights into a learner’s behavior and preferences is the key to success?

Ineffective training strategies

Are your learners not satisfied with your educational curriculum? It seems like the absence of data-driven learning processes, topics, and methodologies unadjusted to learners’ needs may lead to incompetent learning.

Turn Oxagile’s analytics knowledge into your profit

Our client’s most common needs:
We’re willing to add an analytics solution to our eLearning platform to gain more visibility into how we can boost educational efficiency within it.

Custom analytics add-on feature for EdTech

Oxagile’s response:

By joining your software development team, we’ll apply our expertise in the EdTech domain and technologies, enabling big data analytics for your eLearning platform.

All-in-one custom eLearning solution

Oxagile’s response:

We’ll dive deep into your project idea and build a custom eLearning solution adjusted to your specific use cases.

Our client’s most common needs:
We’ve come up with a new EdTech solution idea — the platform with full-cycle eLearning functionality, ranging from educational content management functions to embedded EdTech analytics.

Facilitating big data to serve educators’ needs

For the years in the eLearning domain, we’ve figured out an actionable approach to analytics in EdTech, making measurement, visualization, and engagement insights the three pillars of our cooperation with education experts.

Measure and track EdTech data at any stage

EdTech monetization

Set up monetization KPIs to measure ROI and achieve more revenue

Smart analytics systems let you see how many trainees proceeded after the demo version completion, and how many of them dropped it. To keep track of whether the established monetization strategy works as planned, we can also help you analyze the advertising campaigns and promotional activities.

Must-track metrics include:

  • Ad campaign efficiency
  • ARPU (Average Revenue Per User)
  • ARPPU (Average Revenue Per Paying User)
  • DPU (Daily Paying Users)
  • WPU (Weekly paying users)
  • MPU (Monthly paying users)


Audience engagement

Analyze the effectiveness of your educational course

Data insights help you evaluate how successful your learning materials are. By understanding who from your active audience started the course, who completed it, and who left the course before its completion, you can make the most of your investment.

Must-track metrics include:

  • Learner attendance rate
  • Training completion rate
  • Training dropout rate
  • Churn rate
  • Rolling retention rate


New learner generation

Analyze user feedback to attract more trainees

Information about students’ satisfaction with the eLearning course allows curriculum professionals to understand what course chapters or activities are popular, and which of them need enhancing. Teachers can also assess whether learners are pleased with their methodologies, homework tasks, mentoring patterns, and lesson exercises.

Must-track metrics include:

  • CSI (Customer Satisfaction Index)
  • NPS (Net Promoter Score)
  • COR (Completion Rate)
  • CSAT (Customer Satisfaction)


Post-training effectiveness

Understand how to raise post-training performance

Observing an employee’s or student’s performance after training courses allows educators and trainers to define whether the educational targets have been reached. This can be analyzed through measuring how well they perform while doing their jobs, looking at the company’s profits before and after training, etc.

Must-track metrics include:

  • Post-training quiz scores
  • Training Return on Investment
  • Learner (employee, student) performance
  • Change in operational efficiency


Make EdTech analytics data tell you the insights

Is it high time to organize the EdTech data collected and analyzed in powerful insights? But are you feeling puzzled with the best tools to assist with it? Considering our visualization best practices, we simplify the representation of EdTech data through:

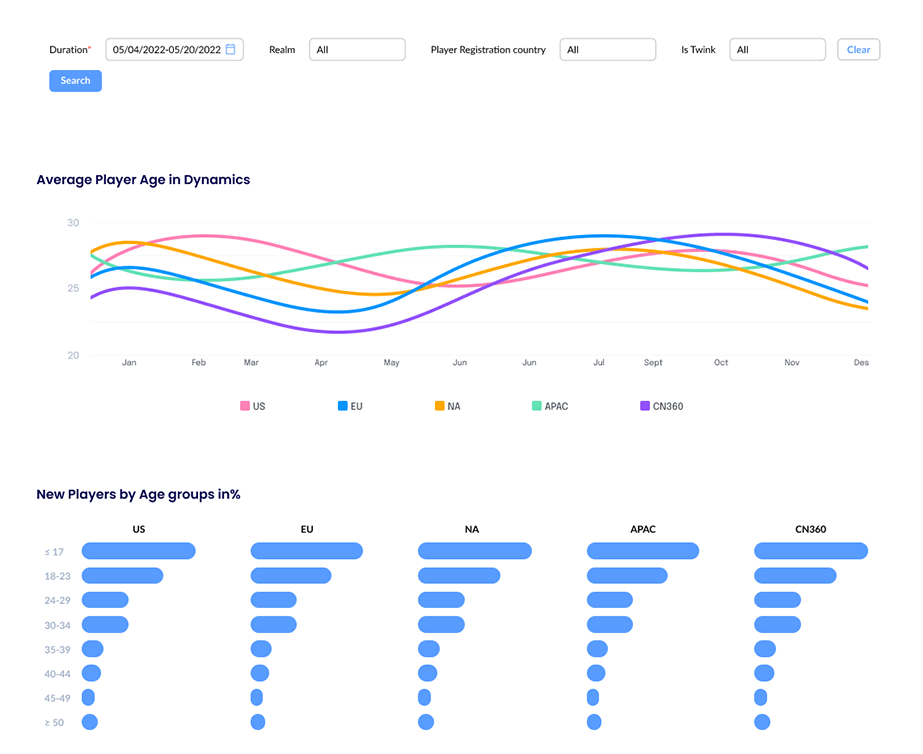
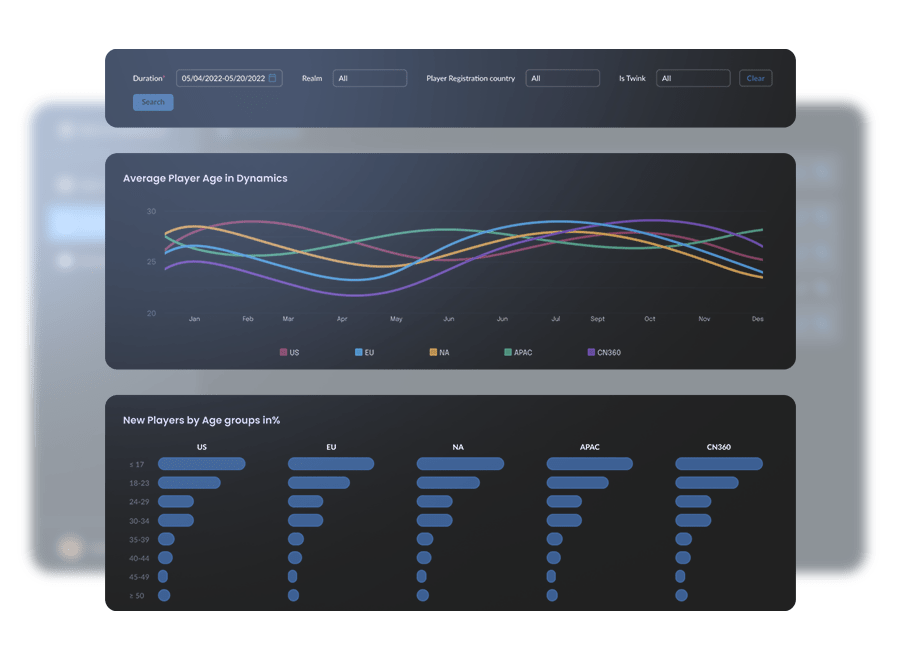
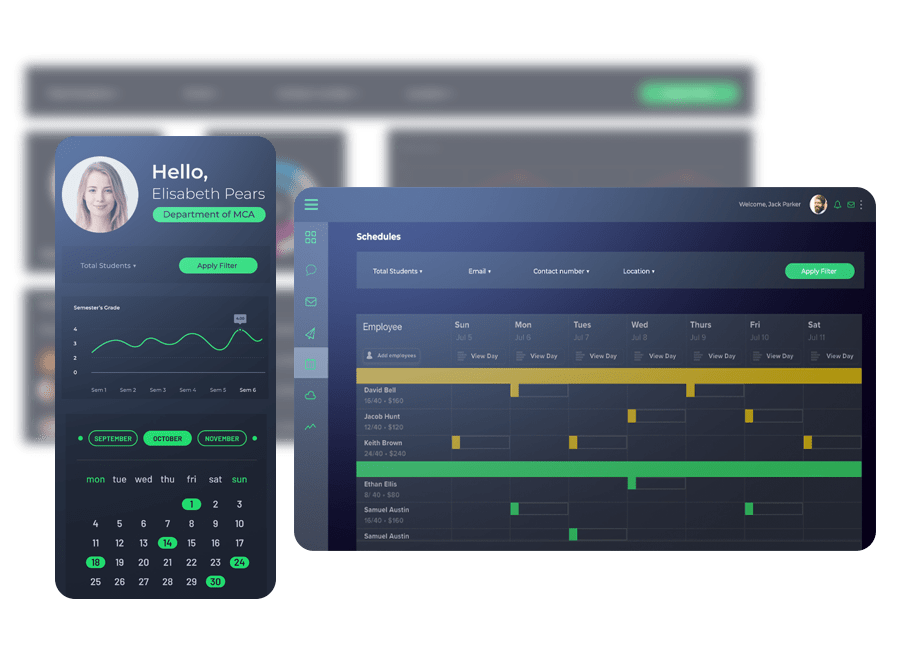
  • Intuitive dashboards and comprehensive reports for EdTech decision-makers
  • Segmentations by users and periods such as days, weeks, months (DAU, WAU, MAU)

This will make it easier to evaluate the digital learning strategy and take data-driven decisions on enhancing their educational materials, platform capabilities, and training methodologies.

EdTech data understanding made simple with trusted BI tools

Carry out actionable reports to boost user engagement with your EdTech

Going beyond tracking and representing EdTech data, we follow an actionable reporting approach providing pragmatic information and data-driven recommendations to EdTech decision-makers, including product owners, technology teams, teachers, and learning designers. We give straightforward “next-step” suggestions on the learning UX, tech stack, and innovations that will bring them to success.