


This website uses cookies to help improve your user experience


That’s more than fair words — whether you need to automate the reporting, speed up decision-making, eliminate the gaps in daily operations, or improve your company data organization and analysis strategy, business intelligence tools come to the rescue.
BI is not about hypotheses or intuition — the decisions guided by BI tools are data-driven, which is a sound way to bigger profits. Sounds promising, but to achieve the increased revenue, you should bank on the right tool first — to reap the utmost benefits from it instead of bleeding money for useless software.
Oxagile’s Lead BI Engineer Dzmitry Shmuryeu is ready to answer this question, showing you a step-by-step guide on careful business intelligence tool selection. Followed once, this way will let you meet all your data analysis and reporting requirements without facing unobvious extra costs or overpaying for unneeded functionality.

Expert comment:
The very first step we usually take before starting a multifaceted BI tools analysis is launching a customer development process.
This intro stage covers targeted sessions with the key stakeholders and product owners where we discover the reasons behind BI tool implementation, all the insights, including functional and non-functional requirements, anticipated from a future BI solution, issues or limitations of the current BI system, if any, which don’t let you meet the analytics needs, etc.
And thus we clearly define a set of criteria to compare possible BI options and decide on the best for each specific business case.
As part of the process, we’re filling out a matrix, considering the factors like the severity of requirements, assigned efforts, development type (OOTB, Customization, Extension), etc. and assigning grades for each criteria. For a comprehensive BI tools comparison, exploring detailed matrixes can help businesses make informed decisions tailored to their specific needs.
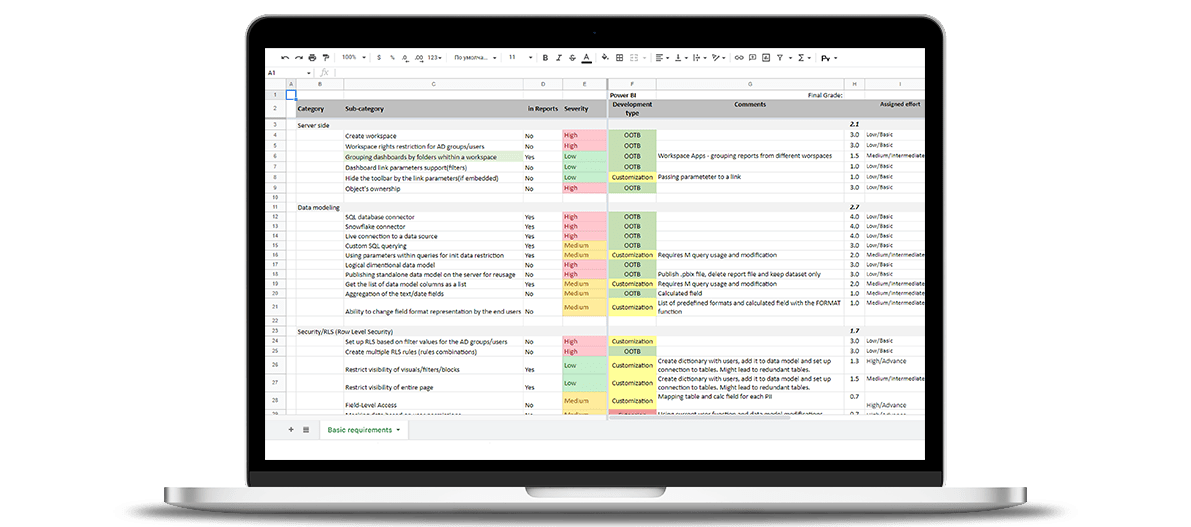
Criteria matrix

Our criteria matrix shows how good Power BI, Qlik, Tableau, and Looker are in meeting this or that requirement challenge, whether extra customizations are required, etc.
Spend one minute of your time filling out the form and get the matrix for free.
After analyzing customer development processes and generating a list of insights, we’re moving to the criteria per se. Let’s dive into the typical set of questions, the answers to which let Oxagile’s BI specialists grade all options considered and choose the winner.
Our BI expert will comment on each question, so you get a clearer vision on which tool characteristics to focus.
Expert comment:
This stage is about defining the desired product capabilities. First, we collect the requirements and then evaluate whether each is covered by the tool under examination. Basically, the list of capabilities examined looks as follows:
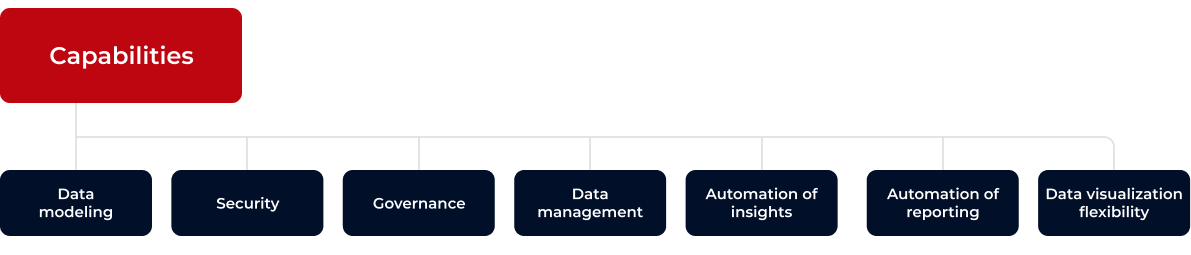
| Category | What’s included |
| Data modeling |
|
| Security |
|
| Governance |
|
| Data management |
|
| Data visualization flexibility |
|
| Automation of reporting |
|
| Automation of insights |
|
Expert comment:
Here we evaluate how easy it is to support and develop reporting systems.
While some BI tools are easy to use without some specific technical knowledge, others require the assistance from the development team. That’s why staff qualification is of paramount importance when the business answers this question.

Are you getting lost in the abundance of BI tools? Tap into Oxagile’s BI services to define the best one for your project.
Expert comment:
I’d recommend viewing the question from different perspectives:
Expert comment:
You shouldn’t underestimate careful examination of all pricing terms, as the final budget may be not so obvious as it looks on the surface.
Expert comment:
While making a choice, businesses determine whether they need an offshore team for BI management or use their own expertise. In the latter case, we thoroughly examine app development capabilities, like APIs, SDKs, extension frameworks, etc., to forecast possible vectors of BI system development.
Expert comment:
How quick and flexible are help centers when you need ASAP assistance? What about the availability of tool-related documentation, like user guides or tutorials? Are there free webinars provided for the well-rounded understanding of system capabilities? These are the details to consider during the system support evaluation.
It’s time to switch to some popular BI tools and compare their characteristics according to the categories highlighted above.
No one typically loses in this game — giving the scores for each functionality or characteristics, Oxagile’s BI team stresses the advantages and weaknesses of solutions for a particular project.
The table we’ve prepared covers a comprehensive Looker and Power BI capabilities overview with brief explanations, deployment models, pricing rules, and scoring based on our BI implementation experience, where:
4 — 80%-99% fulfilment
3 — 60%-80% fulfilment
2 — 40-60% fulfilment
| Category | Looker | Power BI | Comment |
| Data modeling | 3 | 4 | Looker: live connection support only Power BI: own data storage format |
| Security | 3 | 3 | |
| Governance | 4 | 3 | |
| Data management | 4 | 3 | Looker: a convenient SQL query generator Power BI: its queries generated behind visualization go beyond SQL understanding |
| Data visualization flexibility | 2 | 3 | Looker’s UI is more complex than Power BI’s. Both tools have an ability to provide custom visualization, on top of out-of-the-box functionalities. Neither of them allows modifying native objects. |
| Automation of reporting | 4 | 3 | Looker’s scheduling rules for instant or recurring content deliveries are easier and more intuitive. |
| Self-service or dedicated team | 50/50 | Dedicated team | Looker is more appropriate for self-service BI, but requires preliminary data models preparation by qualified analysts or engineers. Power BI is mostly about building analytical dashboards by the team of BI engineers. The tool doesn’t allow end users to construct their custom reports without corresponding permissions and technical skills. |
| Integration and deployment | Cloud / on-premise | Cloud / poor on-premise | Both possess embedded reporting powers. |
| Pricing terms | $5,000/month +12 licenses | Pro: $10 (per user/month) Premium: $20 (per user/month) Power BI Premium per capacity | Minimum number of Looker’s licenses: 12 Looker contracts start from $3000-$5000 a month for 10 users
The Microsoft Fabric license grants users access to the OneLake storage |
| Support service | 4 | 3 | Looker’s support is more proactive in comparison with Power BI’s ticketing system |
| Popularity (1. Google search, 2017-20212. Market share, 2021) | 26.8M 5.9% | 5.0B 35.6% |
For which tasks do the tools do well? Our team introduces their top 5 vision based on their project experience.
1. Implementation of a multi-tenant architecture embedded into a custom web app and managed by Power BI Server API
2. Seamless integration with Microsoft services (Azure)
3. Creation of complex dashboards:
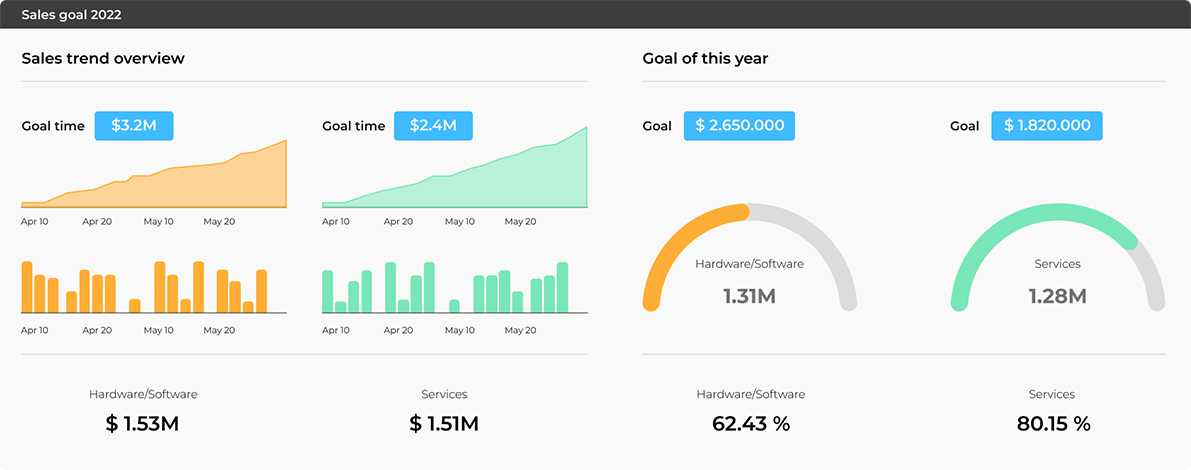
Power BI dashboards
4. Implementation of a custom table constructor visualization to let end users:
5. Nested integration with third-party tools (Python and R) to expand Power BI capabilities and improve analytics
1. Providing end users with a convenient self-service BI tool for report construction where they:
2. Creation of the own custom visuals, while supporting the best JavaScript, HTML, and CSS capabilities
Custom visuals in Looker
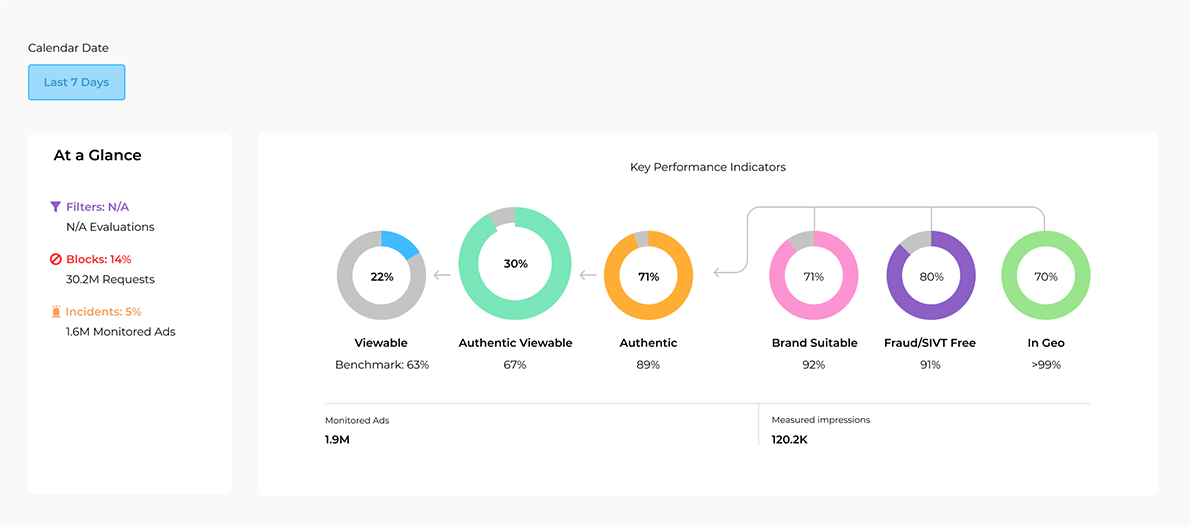
3. Intuitive and responsive dashboard layout with a handy filter panel and a well-designed UX landscape to conduct an efficient data analysis
4. Creation of the more dynamic content using Liquid, a templating language
5. Convenient report builder, with SQL queries quickly generated and fetched via API
So are we! Oxagile is always pleased to delve into your business requests, identify all obvious and underlying reasons for BI tool implementation, carry out a thorough analysis of BI tools available, and come up with the recommendations about the solution that will face all the requirements brilliantly, without hitting your pocket.

