


This website uses cookies to help improve your user experience


Ladies and gentlemen, welcome to the epic Looker vs Tableau BI platforms’ fight!
The arena is set for the Looker vs. Tableau competition, including Google Looker Studio vs Tableau for data analysis supremacy! The two of the biggest players in the business intelligence world, each offering numerous analysis and visualization opportunities for large volumes of data.
Without further ado, here are our contestants:
In the top left corner of our fight ring (the prestigious Gartner Magic Quadrant ™*) we have the challenger — Looker (Google’s team). With its intuitive user interface, Looker has cemented its position as a powerful tool to deliver reliable data insights.
But wait, in the top right corner we’ve got a real data visualization powerhouse — Tableau (Salesforce team). With an arsenal of features to customize every aspect of graphs and dashboards, Tableau has become a top performer that has set the bar for all others to follow.
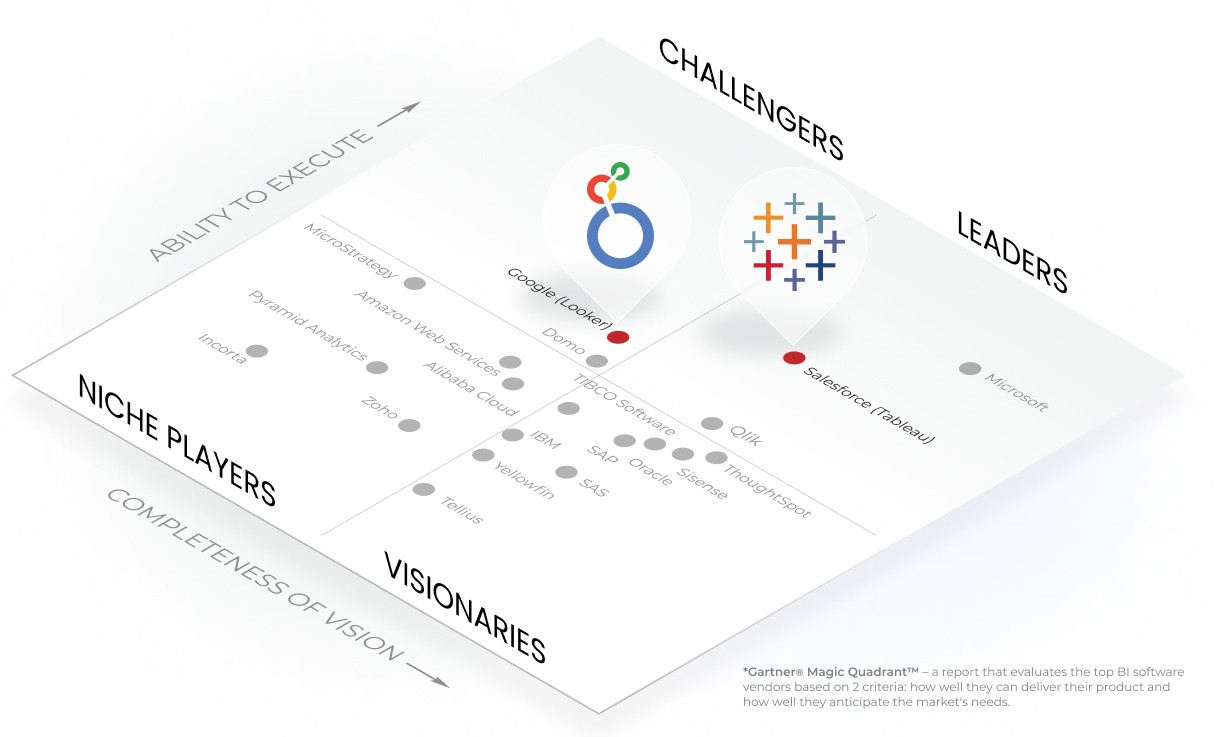
Gartner® Magic Quadrant™
However, do these platforms have the right to claim themselves to be adept at satisfying every customer’s need? What are the limitations associated with each one of them? Time to uncover all the bottlenecks and evaluate Looker vs Tableau pricing to pick out the strongest!
We’ll have a play-by-play account of each tool’s strengths and weaknesses, with each point earning a “punch” for the corresponding BI tool. At the end, we’ll declare a winner based on who landed the most “punches”.
We’re not going to decide once and for all which tool reigns supreme. However, the winner will get to take over from outdated BI systems and will be used for building all-encompassing analytics for companies, whose business needs it will meet to the maximum extent possible.

Oxagile’s Lead BI Developer and Data Visualization Enthusiast with 11+ years of production experience in Business Intelligence and Analysis.
So, let’s brace ourselves for the clash of two great BI tools and observe who comes out as the victor!
The scorecard for judging:

The judge’s comments:
Since Looker is a fully cloud-based platform, it does not require any technical support from in-house specialists. Any updates or releases are automatically applied to the cloud, ensuring seamless and safe integration of new features that enhance its capabilities. They happen without any noticeable interruption for end users, resulting in a lack of downtime. Simply keeping an eye on their website’s release notes is all it takes to stay up to date on Looker’s latest feature rollouts.
It seems that Looker is delivering a powerful blow, requiring no technical support from company specialists and automatically updating new releases for seamless functionality. Will Tableau have something to respond with?
The judge’s comments:
If a company chooses Tableau as the main BI platform for internal analytics, it can be deployed on-premises, which means it should have a physical server. And this, in turn, implies that there must be a person, a server admin, who will be in charge of scaling, updating and maintaining the platform.
Besides, during Tableau’s update process, there is usually downtime where Tableau services become unavailable for an hour or even several hours.
And though there exists “Tableau Cloud”, the SaaS version of Tableau Server, it’s crucial to keep in mind that it still differs in functionality from Tableau on-premises. For example, while Server lets you deploy multiple Tableau sites on a single instance and license, the Cloud version does not include such a possibility. Besides, you may require Tableau Bridge to access the local systems.
Ouch! Tableau’s on-premises deployment is showing some signs of weakness, with updates causing downtime and temporarily unavailable services. However, Tableau Cloud helps it remain on its feet, making this round a tie!

Looker Visualizations
Source: Looker
The scorecard for judging:
The judge’s comments:
Looker is an SQL query generator, which means that all the data that we see on Looker’s dashboards is rendered there after certain queries to the database that it’s connected to. However, these data cannot be stored anywhere inside Looker or its servers.
Looker also falls short in terms of having its own ETL (Extract, Transform, Load) mechanism. But it’s still possible to write a certain model to get a more precise result. For example, you can request the database to show you transactions only by months from a general table with transactions per hour, day, year, and so on. However, this model will still analyze the whole table with transactions from the database, then hide all irrelevant info, and only then display the desired granularity.
At the same time, it’s worth noting that Looker has its own caching mechanism, which works the following way: the retrieved data from a database is cached, and the next time you ask for the same set of data, Looker takes it from the cache, and doesn’t go back to the database. Such cache retention period can be managed (1 hour, 1 day, and so on).
Looker is coming out strong with its ability to modify the final output by writing a specific model, but the impossibility of comprehensive ETL processes and lack of its own data storage are unlikely to allow Looker to hit Tableau hard enough in this round. Or is there still a chance?
The judge’s comments:
Tableau has two options when it comes to data storage: Tableau Live Connection, which connects to a database like Looker, and Tableau Extract, which compresses data and stores it on Tableau’s server for instant results. For example, a query for several million records, which may take a few minutes in Looker or Tableau Live Connection, can be created in Extract in a matter of seconds as it already has the data.
Despite lacking its own ETL mechanism, Tableau has the ability to preprocess those Extracts through data modeling. By specifying rules such as, for instance, grouping by months, you can achieve the required granularity in the Extract and then save it, to eliminate the need for Tableau to scan the original large table every time.
Moreover, Tableau Desktop offers an add-on called Tableau Prep that serves as a comprehensive ETL solution. It’s user-friendly, meaning that you don’t need to be a data engineer to make use of it.
Looks like Tableau’s secret weapon, the Extract format of storing data and ability to deliver results in a matter of seconds, is a real game-changer! And with the Tableau Prep tool, which Looker has nothing to counteract, the winner of this round is obvious. Congrats, Tableau!
The scorecard for judging:
The judge’s comments:
Looker is a platform with the nested integration with Git. This means that each change made in Looker code is automatically recorded in its own branch within this Version Control System. Once code reviews are completed, these separate branches are merged and then deployed into production.
And here comes to the forefront Git’s feature of detecting merge conflicts when changes overlap with one another. This enables the team leader, who conducts code reviews, to either request specifications, ask to perform synchronization or synchronize himself to achieve a unified and cohesive version of the code and dashboard.
Looker appears to be gaining the upper hand, landing a series of powerful punches with native Git integration and seamless collaboration of several users, catching Tableau off guard and leaving it struggling to catch up.
The judge’s comments:
Since Tableau analysts and developers work in the Desktop version and then publish their dashboards to a shared server, after making most changes, one must open the Desktop, modify the dashboard, save the file, and then publish it to the server. This can sometimes slow down the delivery process. Certainly, minor dashboard modifications and user interface adjustments can be made directly on the Server, but there exist certain restrictions.
The parallel work of two or more people on the same dashboard in Tableau can also be a rather cumbersome process. When you publish your changes on the server a few minutes after another person has made changes, the first user’s modifications become invisible as the file is overwritten. And merging these two versions may require extra effort: one must parse the binary file as XML to reveal the textual structure of the code and identify changes.
Tableau tries to keep up, but its arduous processes of tracing and merging modifications made by different users are no match for Looker’s contentious integration. Obviously, Looker takes the victory of this round.

Tableau Visualizations
Source: Tableau
The scorecard for judging:
The judge’s comments:
Looker has a big library of native visualizations that can be used to create any kind of charts, scatter plots, and loads of other visual representations of data. Plus, such visuals are made very responsive and can be automatically scaled to different screen sizes.
Besides, as we’ve already noticed at Looker vs. Power BI competition, Looker is truly a self-service BI tool with a very intuitive filter panel that allows any user to create stunning visualizations without the need for a data expert’s assistance.
However, these visualizations are somewhat limited in their settings and flexibility. But in this regard, Looker has a rescue. If you need a highly detailed and impressive visualization, you can use the API and write your own custom visualization in JavaScript. Although this also creates complexity — you’ll probably have to turn to a front-end developer.
Looker punches with its responsive interface and ease of creating visuals, making Tableau hardly stand straight. But wait, Tableau isn’t going down without a fight!
The judge’s comments:
Tableau has endless possibilities in terms of visualization, because the charts themselves are very flexible, right down to some small things, axis shifts, adding reference slides, and so on. You can customize the graphs as you want, fine-tune them, link graphs to each other, hide and show objects by clicking, add buttons, icons, etc.
And on top of that, you can use the API and JavaScript to write your own custom visualizations or even other extensions.
Though Looker tries to counter with its ability to write custom visualizations using JavaScript, Tableau’s amazing native customization options land a powerful blow which is impossible to withstand. The winner of this round is — Tableau!

Want to find your personal champion in driving actionable insights? Share your goals with our experts and we’ll equip you with the ideal BI software to maximize the value of your data.
The scorecard for judging:
The judge’s comments:
With just a few simple configurations, both Looker and Tableau enable the creation of predictions. For instance, if your goal is to forecast the revenue dynamics six months from now, the built-in prediction tools in Looker and Tableau will be enough.
However, if your prediction needs are more advanced, you may probably need to integrate the BI platform with Python and/or R.
It appears we may be headed for a draw this round…unless! Hold on to your seats, because it seems that Tableau is ready for a new massive attack!
The judge’s comments:
And here comes the difference:
Looker has no direct or built-in integration with Python or R, though you can still implement it through the Looker API. However, since Looker is a cloud platform, setting up this kind of connection to the Python server may be, firstly, a little questionable in terms of security, and secondly, rather time-consuming.
Tableau, in its turn, has native integration with Python and R and you simply need to set up a server-level connection to one of them. You can also set up a connector to Python, which allows you to write code in Python and process data in this programming language, without leaving Tableau Desktop. For example, you can create a metric in Desktop, such as “revenue predicted,” without opening a separate Python editor.
We have a close call! Both BI tools have performed brilliantly in this round, giving users the ability to make predictions and integrate with Python and R! However, Tableau has delivered a knockout blow with its native Python and R integration, making it a clear winner of this round.
The judge’s comments:
Numbers speak louder than words and when you combine them with visuals — they speak even louder! So, here’s a table showing the Looker vs. Tableau fight in terms of pricing: the costs for purchasing an instance/server and the subscription fees for different types of users.
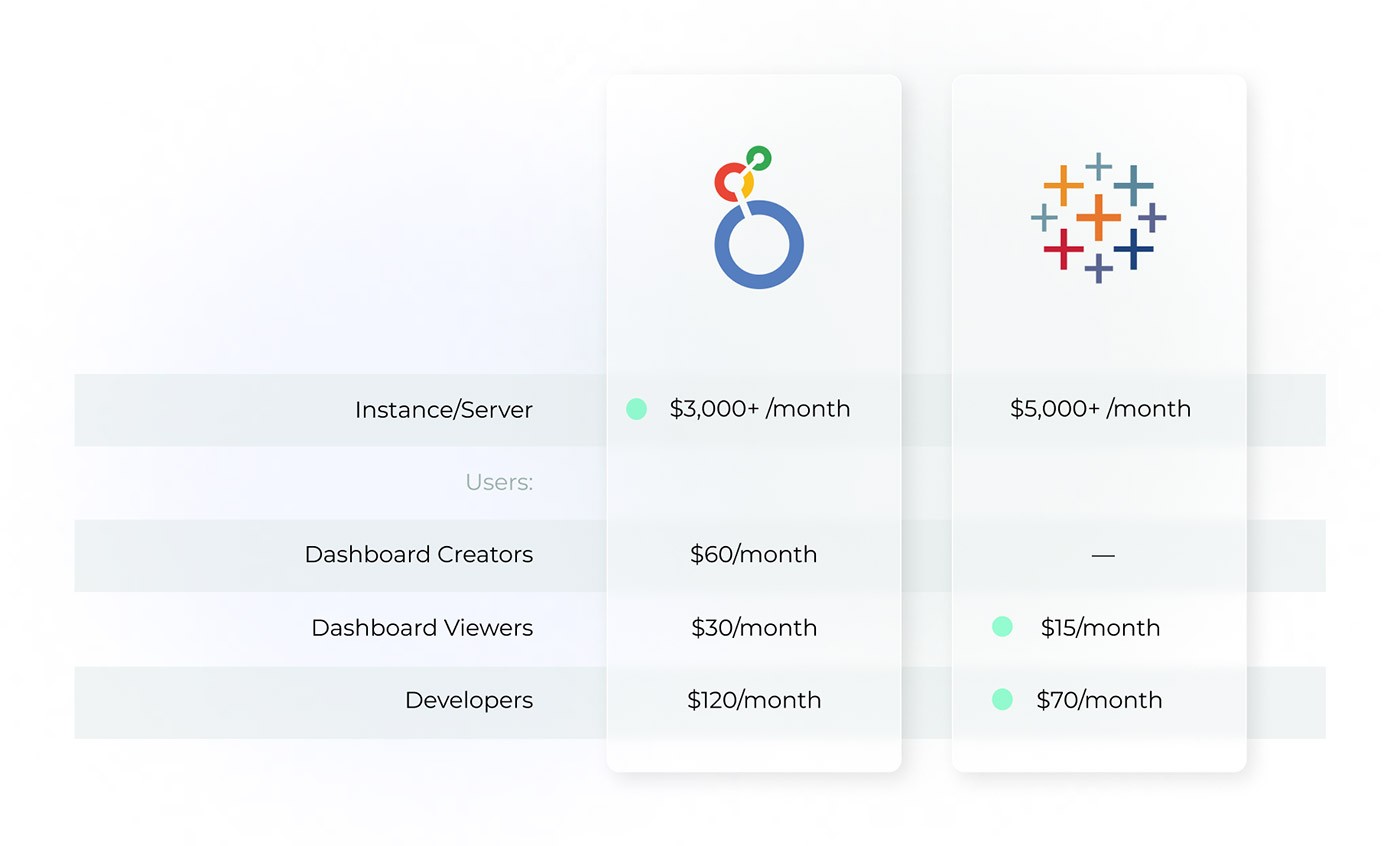
Price Comparison Table
It may seem like this round is almost a draw, however, there is one big caveat — to operate and utilize all Tableau’s possibilities, it’s desirable to have a real dedicated team (with corresponding expenses) in place.
So, we’ll probably leave it to our spectators to decide who the real winner of this round is.
Judge’s final words:
Ladies and gentlemen, the moment has arrived to unveil the results of the Looker vs. Tableau competition!
Both contenders came into the ring with impressive strengths. Looker showcased its great self-service capabilities, letting any user easily build their own dashboards. However, Tableau’s better visualization flexibility, its own data storage format, and native integration with Python and R gave it the edge.
But the truth is, the fight was so vigorous and feisty on both sides, that even though Tableau threw more punches, Looker managed to maintain a solid footing. And the conclusion suggests itself: the ultimate champion for your business will depend only on your specific goals, priorities and resources.
But whatever they are, our expert Oxagile BI software development team is here to help you find the tool that will become your personal winner!

