







This website uses cookies to help improve your user experience


Poor data quality rarely starts with analytics. It starts much earlier: during ingestion, transformation, integration, or storage. By the time inaccurate numbers appear on a dashboard, the underlying problem has often spread through multiple systems, making it expensive to trace and fix.
Why are poor data quality issues so widespread? Is it possible to find all the roots of those errors and guarantee avoiding the drain on your time, money, and opportunities?
This guide looks at the engineering practices that help teams build reliable data pipelines, catch quality issues early, and keep data trustworthy.

Ivan Zolotov, Data Engineer at Oxagile, shares lessons from more than 15 big data projects, including large-scale AWS Glue implementations, and explains where data quality problems originate and how engineering teams can prevent them.
Key takeaways:
Knowing how to handle high data quality, including is sources, flow, and data integrity, is tougher than it seems. Some learn this lesson the hard way though (if you’ve ever played Jenga, you can picture the outcome).
In 2016, researchers found that roughly one-fifth of published genomics papers contained corrupted gene names1,because Microsoft Excel’s default settings silently convert gene symbols like “SEPT2” or “MARCH1” into calendar dates when a spreadsheet is opened. A follow-up study later found the share had grown to nearly a third of all papers, showing that a simple file-format quirk had been quietly corrupting scientific data for over a decade.
In April 2018, TSB Bank migrated 1.3 billion customer records to a new IT platform2, and although the data itself transferred successfully, the resulting system showed customers incorrect account balances, missing transactions, and in some cases other people’s confidential records. UK regulators fined the bank £48.65 million for the failure.
Since going live in 2022, Birmingham City Council’s Oracle ERP system has misallocated close to £2 billion in transactions to the wrong fiscal year3 and ran for 18 months without a working audit trail, leaving the council unable to reconcile its own finances. The resulting chaos contributed to Europe’s largest local authority declaring itself effectively bankrupt in 2023.
In 2024, fintech middleware provider Synapse Financial Technologies collapsed after its internal ledger was found to have never matched the records held by its partner banks4. Customers were owed $265 million on paper, but banks only held around $180 million against those accounts, leaving over 100,000 people locked out of their own funds for months while the mismatched records were untangled.
And it appears that history is not the most effective teacher, since the same mistakes continue to echo over and over again.
Data quality engineering is the practice of building automated systems and pipelines that keep data accurate, complete, and consistent as it moves through an organization. It removes the need to check data by hand after the fact.
It differs from “data quality” as a general goal. Data quality is the outcome you want. Data quality engineering is the discipline that gets you there: defining quality rules as code, profiling data continuously for drift or anomalies, testing pipelines the same way you’d test software, and monitoring quality metrics in production alongside uptime and latency.
The examples earlier in this article share one thing in common. In each case, no automated system caught the problem before it reached a customer, a regulator, or a balance sheet. That’s the gap data quality engineering is built to close.
What comes to your mind when you think about data quality? Probably, something like “a set of metrics that allow us to understand how much of our data is in an adequate format, and to what extent it may be incorrect, lacking or irrelevant.”
And if you were nodding along this definition, we’ve got some news for you.
The point is that the concept of data quality in data engineering is not so one-dimensional and doesn’t stop at crafting metrics to show, for example, how many empty rows there are in your dataset, or how many data have encoding errors.
Ivan notes:
“Analyzing the data in a dataset (i.e., data profiling) is just one of the components of data quality and covers only a portion of the data quality-related manipulations. However, when these two concepts are equated with each other, we get a narrow and simplistic perception of data quality, which leads to tons of challenges and mistakes.”
Now that we’ve ruled out what data quality is not, the question remains: what is it exactly then?
The answer lies in the diversity of processes and operations involved, which go far beyond data profiling. Data quality, within data engineering services, includes metadata analysis, assessing how data is retrieved and then kept in the system, setting up monitoring, testing, configuring reporting, and more. So, by combining these operations in a meaningful way, we identify the following components that are also integral to data quality.
Data governance involves collecting, processing, and establishing standards and protocols for working with data. While algorithms may be part of this process, it is often more important to establish rules that will be used by the people involved.
One key aspect of data governance is also the creation of a unified, centralized data catalog that contains details (i.e., metadata) about all the data used in the company. Such a single point of data management significantly eases work and allows for quick responses to changes and requests.
Therefore, data governance helps reach full compliance with GDPR (General Data Protection Regulation) in terms of data access, with a set of rules to prevent, for example, data engineers from accessing private sets of information.
Ivan explains:
“Data protection in this case does not refer to encrypting it with a password. Here we are talking about the fact that if a person does not have access to certain data, it is as if the data does not exist for them. They will not know that there is any data at all.”
Data lineage is the history of the data, which provides a complete record of the origin, movement, and transformations of data, letting you trace it from its source to its destination, and to understand how it has been changed and by whom.
One of the most advantageous aspects of data lineage is its ability to visualize the data flow across various systems and procedures. This feature allows data scientists to pinpoint possible bottlenecks, inaccuracies, and to guarantee overall transparency and trustworthiness of data.
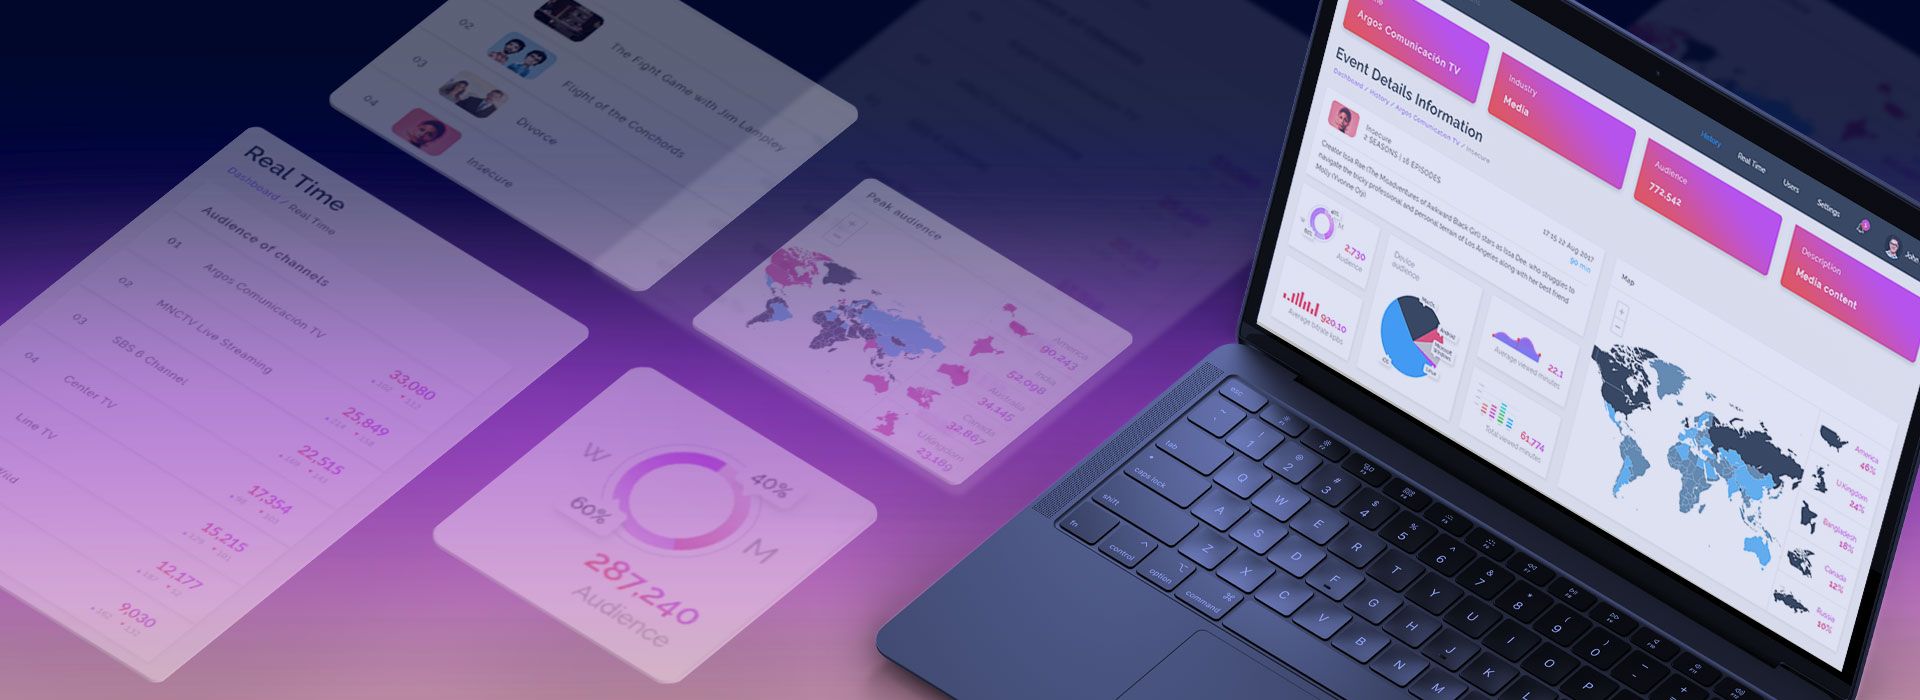
Data quality engineering shows its value when a pipeline produces numbers people can actually act on. A U.S. OTT platform needed consistent statistics on video delivery and audience behavior to plan expansion and improve streaming quality.
Oxagile built a monitoring system on Hadoop, Kafka, and MapReduce that combines historical and real-time data into one reporting layer:
With that data in one place, the client switched to a multi-CDN setup, cutting delivery costs and improving ad CTR through better audience segmentation.
Before we get into the details of effective data quality tools and techniques, let’s identify the gems amidst the rubble and differentiate between low-quality and high-quality data that we will refine into precious insights.
The good news is that we are not left to the mercy of fate here, as there are already 11 specific assessment criteria that provide the right outcome. Here are eleven data quality dimensions:
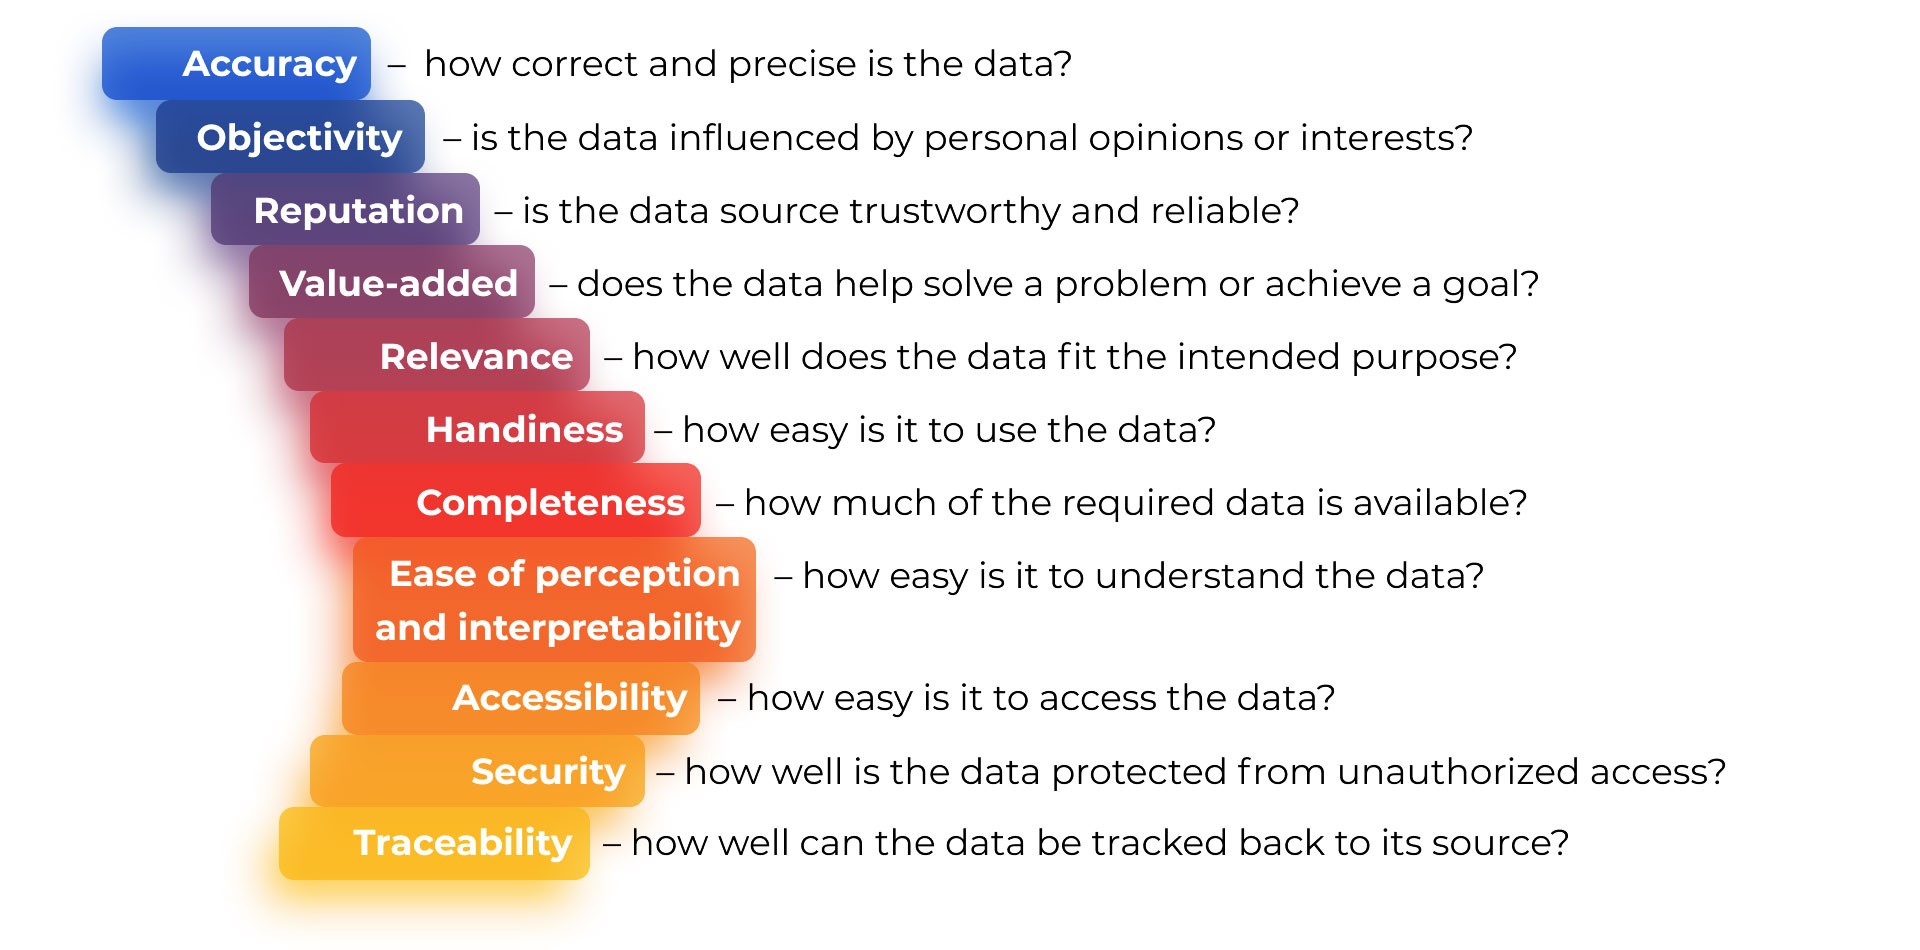
As Ivan puts it:
“Even if you have the most advanced AI and data engineers in the world, not everything can be evaluated by them alone, especially when dealing with intricate subject matter.
For instance, a data engineer might not be able to determine the accuracy of “average protein content in blood” without the input of a domain expert. Therefore, it’s crucial to collaborate with experts in the relevant field.”
Fantastic, we’ve figured out what ideal, everybody-dreams-of data should look like. But what’s the plan now? How can we make sure that it’s handled correctly, particularly in industries where even minor mistakes can lead to massive expenses or even physical harm?
Let’s switch our focus from the theoretical aspect to the implementation and examine how a perfect data quality process functions.
An initial step in the data analysis process, which involves viewing data as an abstract set of information, understanding its characteristics, and deciding how to organize it for further analysis.
At this stage data analysts gather requirements, evaluate data sources depending on the subject area and decide on how the data will be stored (in a data lake or some relational databases).
As previously mentioned, it’s common to confuse this step with the whole concept of data quality in data engineering. However, we’re only on the second step of the process.
Data profiling involves taking a representative sample of your available data, analyzing it, and using the results to establish rules for evaluating the entire dataset. This can be done by a domain expert together with a data engineer, or through the use of smart algorithms.
Based on the results obtained during data profiling, you get sets of criteria (data rules) which are then used automatically or manually to assess the data.
Depending on whether or not the data set meets the rules, you either remediate the data or not.
This step implies continuous checking of the data to guarantee that it remains accurate and consistent on each data pipeline segment.
Ivan adds:
“This isn’t a “set it and forget it” situation. Think of this process as of a continuous cycle of monitoring and refinement, that ascertains that both new and old data are under the microscope for any potential problems.”
Even with the impressive abilities of AI and machine algorithms, achieving that the entire process runs smoothly still requires some good old human oversight. So behind every successful data analysis process, there’s a team of dedicated individuals relentlessly protecting data accuracy.


Bad data doesn’t announce itself, it just quietly skews your reports, your models, and every decision built on top of them. Our data engineers build the pipelines, rules, and monitoring that catch it before it does.
While having a team of experts who know the ins and outs of data management is essential, equipping them with the right set of tools that they can benefit from to maintain perfect data pipeline is equally important.
While AWS Glue is a fully managed ETL (extract, transform, load) service provided by Amazon Web Services (AWS), it has one feature that is of particular interest to us: Data Quality, which greatly simplifies the process by automating it.
It can be in charge of profiling, creating quality rules, computing statistics, monitoring the current state of data pipeline, and alerting you in case it notices that the quality has become worse. Currently, AWS Glue supports tables in Apache Iceberg/Hudi/Delta Lake formats, integrates with Amazon SageMaker Unified Studio, uses DQDL labels for managing rules of the business context and generative AI assisting in rules creation.
It’s a domain-specific AWS language used to define data quality rules and metrics that can be used to measure and monitor data quality.
It is an open-source library for data quality assessment based on Apache Spark. It provides various metrics and tools to evaluate the quality of data, such as data completeness, consistency, and accuracy. It also supports customizable data quality rules and allows for automation of data quality checks.
This is a technology that allows the development of data access policies within a data lake using a high-level set of rules. The data format is abstracted on a disk and a set of rules is specified from the top so that people, such as engineers, do not have access to private data in accordance with GDPR.
Lake formation allows restrictions on individual tables and columns within those tables in read and write mode. If there is anonymized data and personal data in one file, access can be restricted only to personal columns.
It is important to mention that Lake formation is widely used for managing data quality in Iceberg/Hudi/Delta Lake tables together with Glue Data Quality.
So, ladies and gentlemen, we’ve nailed it! We have constructed a great data quality pyramid strengthened by experienced data engineers, latest technologies, and quality standards. It’s a recipe for success, wealth, and everything that’s hip.
There is only one more detail left: a solid foundation. The underlying principles that are the backbone of all the data quality operations in our team.
So what are the best practices data engineers use to manage data quality once the pyramid is built and the pipeline is actually running?

Without a set of rules that every team uses to evaluate data, you get duplicate records, mismatched formats, and confusion about who’s responsible for what.
These rules typically define:
Developers often formalize this as a data contract or data dictionary, so a change on one side of the pipeline doesn’t silently break something downstream. With standardization and clear communication in place, everyone evaluates data the same way, regardless of who’s touching it.
A monitoring and reporting system that flags data quality issues can start small. Even a simple alert on a failed validation check catches a lot.
As pipelines grow, monitoring usually expands to:
Catching these early, before the data reaches a dashboard or a model, is what separates a system that prevents problems from one that only reports on them after the fact.
Making sure there’s no unauthorized access to private or confidential information is not optional. A failure here can mean financial loss, reputational damage, and legal liability.
In practice, this means:
Regulations like GDPR add specific requirements on top of this, but the principle stays the same: people should only see the data they actually need for their work.
The three principles above set the direction. Here’s what they look like as day-to-day habits.
Before building anything on top of a dataset, look at what’s actually in it: null rates, duplicate keys, outliers, value distributions. Profiling won’t fix bad data on its own, but it shows you where the problems are before they surface somewhere more expensive, like a dashboard or a model.
Catching a bad record when it enters the system costs far less than catching it after it’s already fed into other tables, reports, or models. Validation rules at ingestion, format checks, range checks, required fields, stop errors before they can spread.
Data quality tests belong in version control and CI/CD, same as application code. A schema change or a broken transformation should fail a build automatically, not weeks later when someone notices a report looks off.
Not every dataset needs a named owner, but the ones feeding financial reports, customer-facing products, or regulatory filings do. Without a clear owner, quality issues get noticed by everyone and fixed by no one.
Data lineage, knowing which source, transformation, and pipeline produced a given value, turns “why is this number wrong” from a drawn-out investigation into a quick lookup. It also tells an owner whether a problem started in their part of the pipeline or came in from somewhere upstream.
Profiling shows you what’s broken. Validation stops new errors, but won’t catch what’s already wrong. Ownership only works if lineage makes it possible to trace a problem back to its source.
Every example in this article, a bank whose ledger never matched its partner banks’ records, a city council that couldn’t tell which fiscal year a payment belonged to, a chatbot confidently telling people to break the law, comes down to the same root cause: nobody built a system to catch the error before it reached a decision.
None of these were accidents. They were the predictable result of treating data quality as a cleanup task instead of an engineering problem. Rules, monitoring, and governance, applied consistently, catch bad data before it reaches a report, a model, or a customer.
This matters even more as companies move analysis away from spreadsheets and into automated dashboards and pipelines. Data quality for analytics engineering shares the same foundation as data quality anywhere else, but the stakes go up: a bad number doesn’t sit quietly in one cell, it propagates through every report built on top of it.
Our Business Intelligence and Big Data teams work with companies to build the rules, monitoring, and governance that keep data reliable at scale, not just clean it up after something’s already gone wrong.
1. Gene name errors are widespread in the scientific literature — Springer Nature Link
2. TSB fined £48.65m for operational resilience failings — Financial Conduct Authority
3. Birmingham City Council’s Oracle implementation explained: What went wrong? — Computer Weekly
4. Synapse bankruptcy trustee says $85 million of customer savings is missing in fintech meltdown — CNBC

Data profiling is one step: scanning a dataset to see what’s actually in it (nulls, duplicates, value ranges). Data quality is the full process around it, including governance, monitoring, remediation, and lineage. Profiling tells you what’s wrong, but the rest of the process is what fixes it and keeps it fixed.
Completeness, accuracy, consistency, timeliness, uniqueness, and validity. Most data quality rules end up mapping back to one of these six.
Data discovery, profiling, rule creation, remediation, and ongoing monitoring. Each step feeds the next: discovery defines scope, profiling reveals problems, rules formalize what “good” means, and monitoring keeps it that way over time.
You can’t set rules or profile data you haven’t identified yet. Discovery maps out what data exists, where it lives, and how it’s structured, which is the baseline everything else in the pipeline depends on.
Bad data feeds bad decisions: wrong forecasts, misdirected budgets, faulty models, compliance failures. The cost isn’t abstract either, it shows up as regulatory fines, lost revenue, or reputational damage once the decision made on bad data plays out.

