


This website uses cookies to help improve your user experience


It’s no revelation that all EdTech companies (be it learning platforms like Coursera and Busuu, or course marketplaces like Udemy, Domestika, etc.) hardly set their growth directions relying simply on inner intuition. Every decision these companies make is (or should be) based on data-driven analysis of all educational process components.
And you’ve likely come across many clickbait materials eloquently enumerating the ways data is transforming education with improving performance efficiency, creating customizable learning programs, personalizing content for individual needs, and… we could go on forever.
But here we focus not on generic advantages, but on how EdTech metrics grounded in big data in eLearning help companies measure performance, retain learners, and adapt to rapidly changing demands.
So, let’s not take away the bread from such articles on obvious Big Data benefits. You’re probably here for more precise and actionable ideas, like:
Oxagile’s expert will equip you with these and other crucial insights that ensure Big Data makes any EdTech platform perfectly do what it should — captivate an ever-growing number of students with 100% effective courses.

Dzmitry Shmuryeu, Oxagile’s Lead BI Developer and Data Visualization Enthusiast with 11+ years of production experience in Business Analytics and a proven track record in the EdTech domain, including significant involvement in product development processes.
Since the performance and overall success of any eLearning product can be examined from diverse viewpoints, we’ll explore 3 distinct aspects that one needs to measure for a comprehensive picture of the way different elements within the platform impact its dynamics.
Recent reports show that data-driven personalization in eLearning increases course completion rates by up to 50%, as learners are guided through adaptive recommendations that fit their pace and goals1. Moreover, platforms that rely on predictive analytics and retention dashboards reduce student drop-off by about 35%, proving the tangible business value of big data in education2.
This metric implies collecting data on the students enrolled in the course, with the purpose of understanding how effective and compelling training programs are to keep them engaged. As a result, you get a chance to fix any issues at the right stage to maintain current users’ interest at the desired level and to bring back the lost ones.
Expert advice:
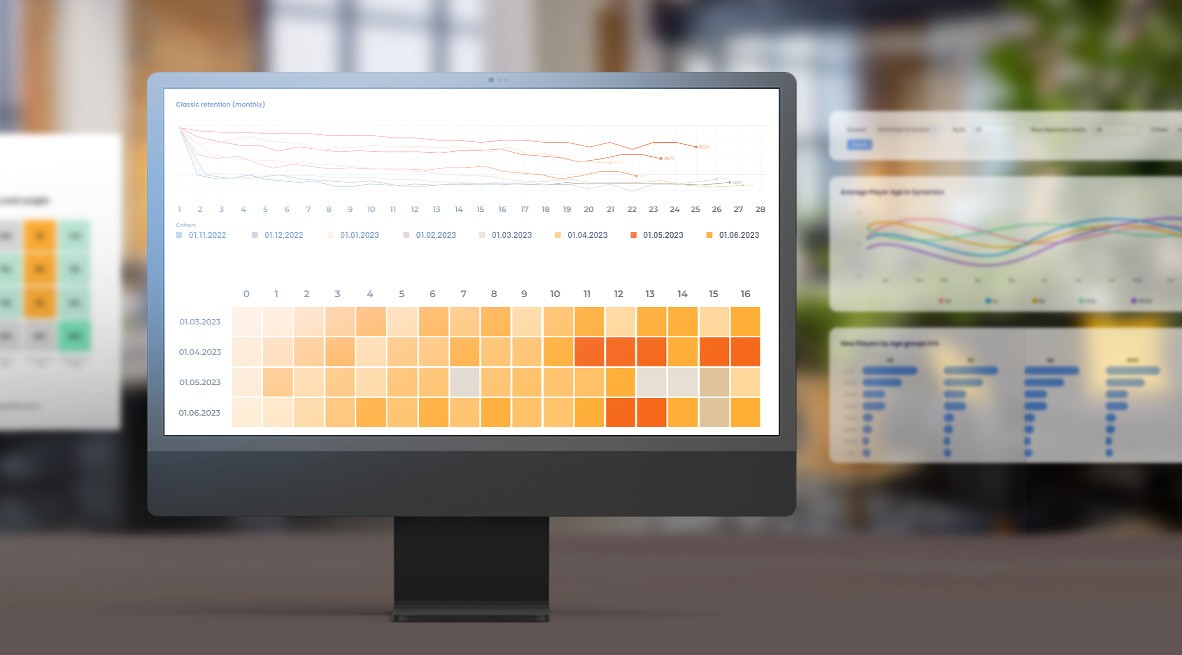
“Retention Rate is found to be most effective when being calculated and interpreted both in terms of cohorts (e.g., registration dates) and periods.
To assess the effectiveness of product changes, other strategic actions, or to identify emerging trends, such metrics as DAU, MAU, WAU should better be displayed in dynamics.
For some metrics, it will be also useful to do the segmentation of users, which will allow the generation of analytics within each segment (e.g., active learners, those who migrate to a more budget subscription, etc.) and applying a specific and custom approach for each case.
So, if you determine a category of “off-track souls” — the users who have registered, bought a subscription, set auto-renewal, but do not use the products, do not log in or do not attend classes, you might want to rethink their involvement, offer them some custom proposals, send personalized reminders and notifications, include more interactive activities, or simply facilitate discussions.”
A detailed analysis of user behavior, starting from him seeing an enticing ad to becoming a paying customer (assuming that the course is fee-based), helps to evaluate the effectiveness of the whole process and understand the possible problems. They can range from technical glitches to UI/UX issues regarding non-obvious clickable elements. Additionally, there may be cases where the offer is simply not interesting for certain users, resulting in them clicking on an ad but not progressing further.
Studies by UNESCO indicate that learners who interact with adaptive UX (where content adjusts based on data-collected behavior) show up to 2.5× higher engagement compared to static eLearning environments1. This highlights how tracking user paths isn’t only a marketing metric, but a tool for shaping educational experience itself.
Expert advice:
“The thing to consider here is the source of data (whether it’s a website or a mobile application), because each of them has a different funnel for tracking a user’s path. For example, the initial stage for mobile apps’ funnel involves tracking the number of people who visit the application page, the subsequent number of downloads, and then the funnel progresses similarly to the web, measuring metrics such as registrations, and so on.”
While it’s unlikely to be news to you, we still feel like emphasizing that timely gathered and processed user feedback has all the chances of becoming the easiest way of creating an ultimately pleasant experience for everyone involved.
According to PwC’s Future of Learning Experience Report, companies that actively analyze feedback and learner behavior data see their satisfaction scores rise by an average of 40%3. Moreover, ongoing sentiment monitoring through analytics tools is linked to up to 60% higher NPS values compared to organizations that rely on occasional surveys4.
Expert advice:
“On top of these three types of metrics, there is an aspect that is also undoubtedly worth your attention — it’s Payment Success Rate (PSR). This metric focuses on the reliability and efficiency of payment systems, as well as the proportion of successfully completed payments in comparison with the total number of orders.
Here we are specifically referring to technical aspects at the stage of processing the payments: the reliability of the eCommerce system, the percentage of orders that are completed successfully, the number and reasons of failures, the quantity of pending cases, and related issues.”
It’s important here not to confuse users who are unable to make payments due to issues outside your platform with users who experience difficulties with payments due to poor UX on your side. This way, by closely monitoring these two different, yet similar, processes you’ll be able to promptly address the issue, for example, by reaching out to the support team of the payment system.
No matter how much in-depth data you obtain, the primary objective is to ensure its clarity and accessibility for analysis. And that’s where graphics and visual presentations of all patterns and correlations come to the forefront. A good dashboard lets even those who do not have specialized Big Data skills (like marketing or product operation teams) examine all the complex data sets from different angles in real time.
In practice, a well-designed dashboard turns raw data into a decision-making tool that helps teams track behavioral trends, evaluate the impact of product updates, and respond to early warning signals before small issues turn into user churn. For EdTech platforms, this transparency is crucial: it connects educators, developers, and business teams around one shared picture of learner performance, encouraging faster, evidence-based decisions.
So, what does it take to create a comprehensive dashboard with all education metrics? Here are the key things to consider:
Ultimately, the real goal of Big Data visualization in education is not to showcase more numbers but to reveal meaningful stories, helping teams understand what drives engagement, retention, and satisfaction, and how these insights can shape continuous improvement.
Expert advice:
“To fully leverage the available information, it’s vital for the dashboard to have a drill-down capability.
Let’s say you notice that the overall retention rate has dropped. In an ideal drill-down dashboard, you would be able to click on the specific month and see which products and services experienced a decline in retention. A competent and dedicated product team, responsible for that particular product, can then quickly identify the reasons influencing these results. For instance, if the retention rates have decreased for a specific subscription after a recent interface change, the team may decide to conduct a survey among product users to get feedback and better understand the situation.”
Oxagile will meet any of the project deliverables.
To make any dashboard with complex data tell not only colorful, but meaningful stories, our expert transformed his experience working with learning platforms and coaching services into best practices and a set of optimal strategies. In data-driven education, visualization becomes most valuable when it helps teams not just observe changes but act on them. That’s why the following principles focus on turning insight into improvement.
Expert advice:
“Let’s mention 24/7 dashboard monitoring by key stakeholders who periodically keep an eye on top-level dashboards with core KPIs. If the dashboard is more detailed and supports drill-down functionality, such dashboards can also be used by special departments that directly implement targeted actions and initiate product changes (e.g., marketing, sales, PR, LiveOps, development and operations teams, etc.).
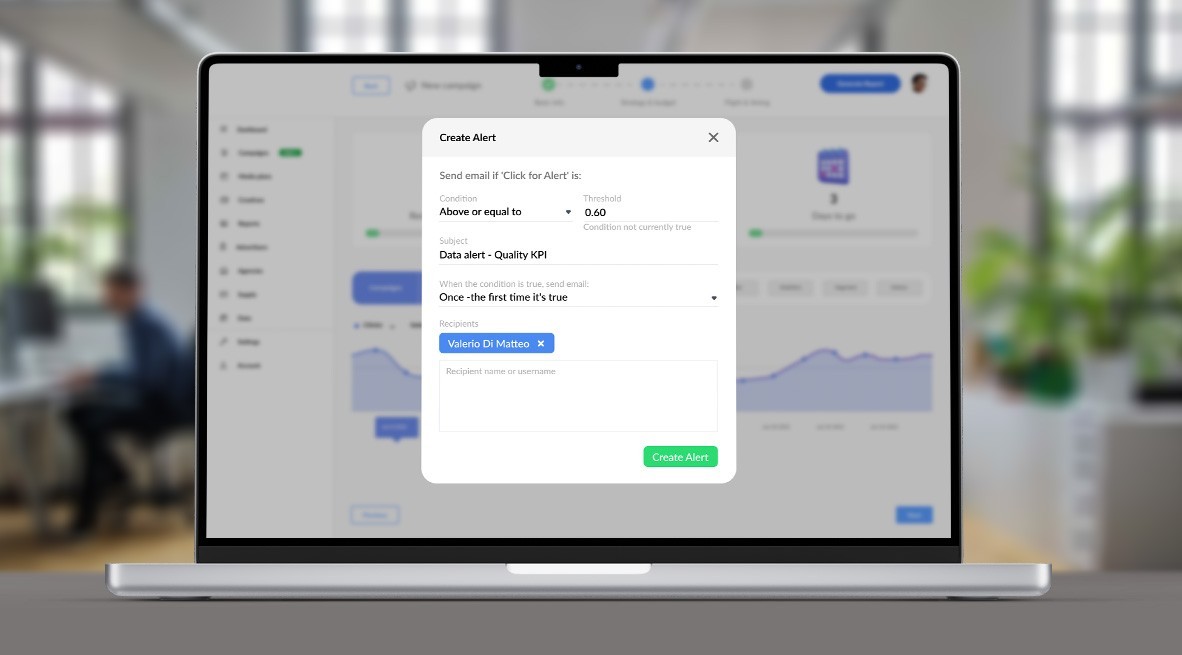
Plus, timely alerts and notifications matter too. Automation and alerting are crucial when receiving scheduled email or messenger notifications with either a snapshot of the current dashboard or specific values of critical metrics. Alerts can also be configured for notifications in case a metric drops below a threshold value. A well-thought-out alerting system helps avoid delayed reactions. Instead of finding out about falling engagement rates days later, product teams can instantly investigate anomalies, pinpoint potential causes, and address them before learners even notice the problem.
And here’s a detailed view on how to act right. If business intelligence functionality allows you to investigate the causes and get a list of users who have abruptly left, this may require several dashboards with more detailed information on each. The dashboards can be interconnected, so any of your employees from different departments can see the whole picture and get all the necessary details to take further action.”
In an ideal scenario, you’d be able to quickly create an all-encompassing data analytics solution that presents high-level statistics, as well as user-level details. However, achieving such functionality requires a meticulously planned and optimized architecture. Besides, not every system can handle the vast amount of data. Therefore, to still have a chance of getting data-driven insights, it becomes crucial to conduct on-the-spot analysis.
Ad hoc analytics act as a bridge between standard dashboards and deeper business intelligence. They help teams move beyond surface-level metrics and find answers to specific questions that arise during product growth, marketing experiments, or performance drops.
Analysts take on the task of unloading the list of users based on certain conditions and supplement the data with additional details. For example, if you find that 50% of users left last month, the data analyst uploads a list of users who were previously active in the product but stopped using it. He also adds information about these users’ payments and activity in your other products, as well as the results of surveys conducted among them.
This flexible approach allows EdTech companies to validate hypotheses fast, without waiting for a new reporting cycle or heavy engineering input. The resulting insights often become the basis for immediate retention campaigns, pricing tests, or UX adjustments.
Once this data is obtained, these users can be tagged in the CRM system, which initiates personalized efforts to engage and retain them. The dashboard analyst can independently perform a descriptive or diagnostic analysis of the data, or simply provide a raw report.
In mature data ecosystems, ad hoc analysis complements automated dashboards rather than replacing them. Dashboards provide the “what,” while ad hoc exploration answers the “why.” Together, they form an analytical loop that keeps product teams proactive and focused on continuous improvement.
Expert comment:
“One of the most important and, let’s face it, pleasant things about Big Data analytics is that all the research findings can be used perfectly well not only to fix immediate issues, but also to shape the future of your business. Years from now? Why not!
For example, in one of the recent educational projects (a language learning platform) I was involved in, we introduced interactive New Year’s gamification elements. Some were very trivial with bursting balls with right translations and getting random discounts, and some were almost substantial educational quests with characters and storylines that enabled getting more significant benefits if successfully completed.
And thanks to the fact that during that hot New Year’s campaign we have clearly monitored our every user’s action related to our innovation, the next year the marketing specialists had a thorough dashboard on hand that showed exactly which activities were received with enthusiasm by particular groups of users, which had all the rights to be considered mishaps, and what modifications could be made to game characters to ensure the highest conversion rate possible.
And voilà — the next year showed a nearly three-fold increase in profits over the Christmas period. And yes, the best part is still that this year such monitoring will take almost no effort, because all the processes are already set up.”
Behind every efficient EdTech platform stands not just a collection of dashboards, but a culture of data-driven thinking. Metrics lose their meaning if they don’t translate into product growth or better learning outcomes. By aligning analytics with real educational goals — engagement, satisfaction, knowledge retention — companies move from tracking performance to shaping it.
The next step for any mature EdTech business is to evolve from monitoring to prediction. Machine learning models can forecast learner success, anticipate drop-offs, and recommend personalized interventions long before problems occur.
Integrating these predictive layers into existing dashboards creates an intelligent learning ecosystem — one where decisions are guided by insight, not intuition.

At Oxagile, we help education providers make this transition smoothly. Whether it’s building a unified data architecture, setting up real-time dashboards, or enabling AI-driven analytics, our goal is the same: to turn every data point into a step toward better learning experiences and measurable business impact.
1. UNESCO — Global Education Monitoring Report 2024: Data for Learning
2. Deloitte — Digital Education Insights: Transforming Learning Through Data
3. PwC — Future of Learning Experience Report
4. McKinsey & Company — How Analytics Can Improve Student Outcomes and Institutional Performance

