


This website uses cookies to help improve your user experience


OTT and online media content become more and more widespread among people around the globe. The global streaming analytics market is experiencing explosive growth, valued at approximately USD 35.05 billion in 2025 and projected to reach USD 176.29 billion by 2032, with a CAGR of 26.0%1. This underscores the critical importance of implementing robust user activity monitoring and user activity tracking.
The way users access media and entertainment information can be translated into meaningful insights that help companies develop and fine-tune online services and business strategies. Together with modern technologies in big data storage and processing, this untouched field of user-generated data analytics should be investigated and efficiently used. By harnessing this information, businesses can predict problems even before they occur and prevent harm to the customers.
With resources reallocated to the points where they are required at the moment, it is possible to define pros and cons of the existing development strategy and make significant service improvements. Visibility helps control the service and make the right decisions to increase business value.
Providing a general overview of data analysis, we can distinguish two major approaches — batch analytics and real-time analytics.
It is important to emphasize yet another difference between the approaches. Within the batch analysis approach, data gets stored and processed offline to further provide a backward-looking overview of what has already happened. Real-time analysis delivers a forward-looking overview of events, their drivers and consequences. This helps figure out what can actually happen in the future, making more reasoned and beneficial decisions.
The shift from batch to real-time streaming analytics is driven by the unchecked growth in data; global datasphere was projected to reach 175 ZB by 20252. This sheer volume of streaming data makes batch analytics increasingly impractical and underscores the need for scalable solutions to track user activity on website and platforms in real time.
Over the last years, benefits of the systems that contain many isolated elements rather than a single piece have become obvious for developers and project managers. It is well-known that there are two major approaches to architecture development — monolith and microservices architecture. In brief, the main difference between them is their management and operations agility.
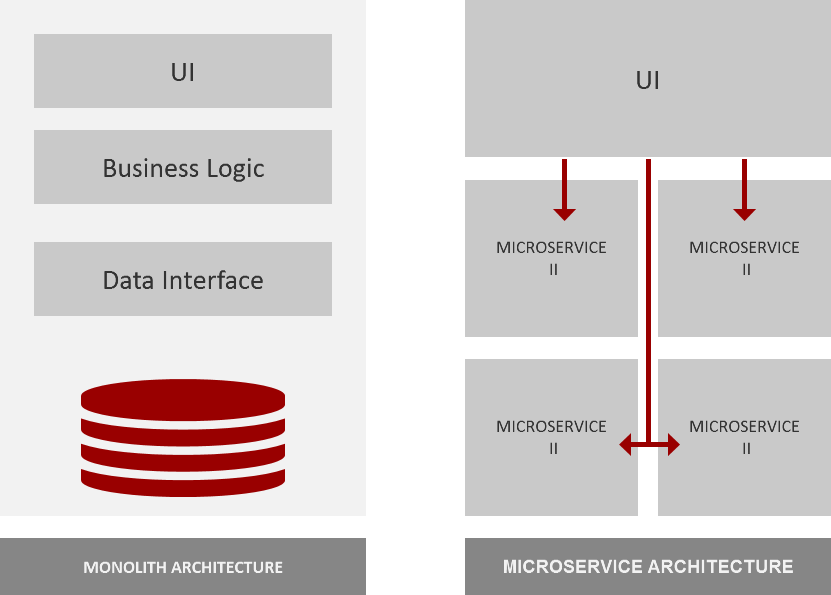
An error in one element of microservice architecture will not cause a crash of the entire system and will not stop data processing. Moreover, it is possible to update a certain element without affecting the rest of the system, or add and delete elements without breaking the whole architecture.
On the other hand, monolithic systems show significant stability, as they aren’t affected by changes made by individual developers, as compared to microservice-based architectures.
In general, both approaches can be perfectly suitable for business needs, since they have totally different capabilities and application areas. In this article, we don’t want to focus on comparing the pros and cons of these approaches. What we want to do is to show how beneficial the microservice architecture can be for real-time streaming user activity monitoring, user activity tracking, and online user activity management.
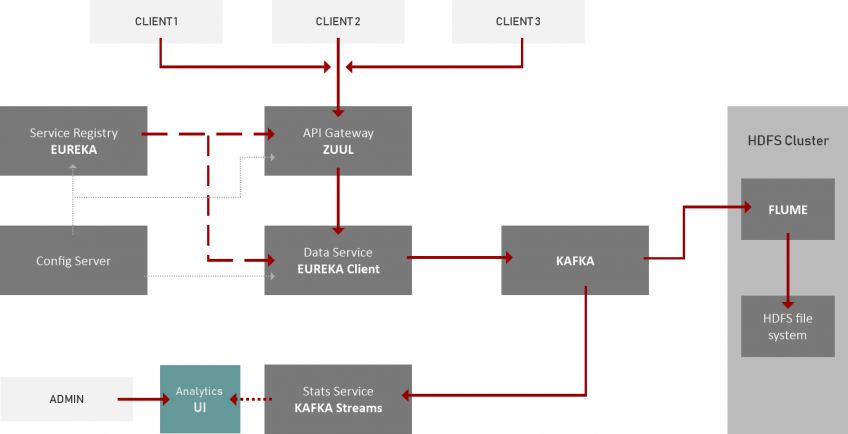
In order to create a representative sample of a system, it is reasonable to use Netflix OSS microservices, which are believed to be effective, simple in implementation, and able to quickly connect to external services and form a functional system for big data processing and record analysis.
In our case, we take basic and the most popular microservices like Zuul and Eureka that help create system infrastructure and ensure communication between architecture elements.
The Eureka microservice is used to register other architecture components that are supported by configuration servers where all configurations and settings of the system’s elements are kept.
The Zuul microservice is a gateway that’s used to provide routing, monitoring, security, and load balancing functions. It routes requests to specific services further into the system. Once a call passes Zuul API, it goes to a customized data service that receives user-generated data and transfers it to the HDFS infrastructure.
HDFS runs on the file system cluster that can be represented by any system suitable for your business objectives (for example, the best known Hadoop works well with Apache Flume), Apache Flume that collects and transfers huge amounts of log data between queuing software and HDFS cluster, and Apache Kafka, a streaming platform that queues messages and records coming from the user and transfers them to HDFS clusters.
Apart from receiving and storing procedures, it is very important to focus on the main challenge of the task, the one of creating real-time analytics to detect trends and patterns in user activities. To do this, we implement an additional service that extracts statistics and meaningful insights on online user activity from the data that’s stored by topics in Kafka.
Based on the Kafka Streams application, our Stats Service receives and aggregates the insights from Kafka, grouping and reallocating them in a way to provide a meaningful report. All this happens simultaneously with the new calls, and the statistics are generated in real time.
As a result, we obtain a flexible pipeline where elements can be easily excluded or added to the system in line with changes in requirements to business objectives. We can implement the service to track user activity across an OTT platform or website, collect the data, and efficiently store it in the HDFS cluster for further usage.
On top of this, we can add an analytics microservice to extract meaningful insights from our data in real time, provide new opportunities for business decision-making, and offer tech improvements. Furthermore, flexible microservice architecture enables us to increase the scale and complexity of analytics systems, improving them in line with new requests and challenges.
According to industry surveys, 85% of enterprises are managing complex applications with microservices3, and Gartner reports that nearly 74% of organizations have already adopted microservices, with an additional 23% planning to do so soon4. This widespread adoption supports our architectural choice for scalable and resilient real-time systems.
Building the major system mock-up upon microservices, developers have no need to update the whole system any time they change core functions like analytics.
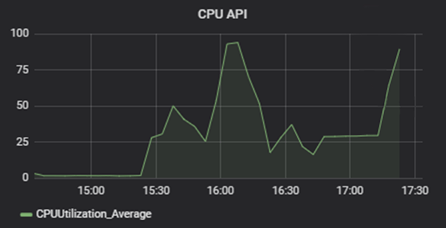
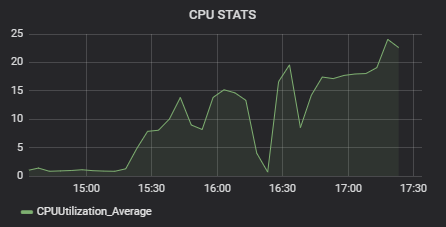
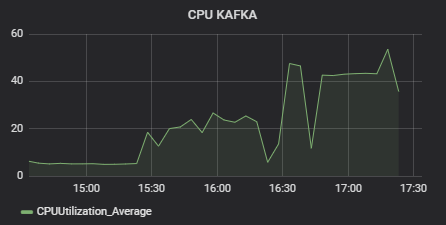
To test the architecture, we modeled a situation when 500,000 users simultaneously use an OTT service, switching channels once a minute. For a sample system with such architecture, the performance was quite impressive. Kafka showed 50% of CPU load, with 25% Statistics Service CPU load.
Tests were run on AWS T2 micro instances. The cluster of Zuul — Eureka — Config Server — Data Service was the most load-consuming, reaching up to 80% of CPU load, with the majority taken by the in-house crafted Data Service element.
Recent industry reports show that global OTT video users exceeded 3.5 billion in 20255, and the average viewing time per user continues to rise annually. By applying such load testing scenarios, businesses can validate the stability of online user activity management systems and confirm that real-time architectures scale efficiently with surging user bases.
To conclude, using microservices can be an effective and reasonable way to scale and optimize product development while achieving good performance. Their flexible and scalable structure allows to extend basic data receiving and storage functionality with additional components like data analytics tools.
With Kafka and Kafka Streams, the data analytics tool can easily analyze any sort of user activity data. In our case, the microservice-based system enabled us to define each user’s channel preferences and calculate the channel load. Due to Kafka’s capability of collecting any kind of user-generated data, the solution is flexible, and the reports can be configured and tailored to specific business needs.
Most importantly, such systems enable continuous user activity monitoring across OTT platforms and websites, helping organizations deliver consistent user experiences, optimize infrastructure costs, and anticipate demand spikes.
By integrating real-time insights into online user activity management workflows, businesses can improve decision-making, accelerate innovation cycles, and maintain competitiveness in rapidly growing digital markets.

Oxagile’s experts will be glad to share their expertise on handling data analytics and help you implement the most optimal architecture and solutions.
1. Fortune Business Insights — Streaming Analytics Market Size, Share & Growth Report, 2025–2032.
2. IDC — The Digitization of the World From Edge to Core.
3. Statista — Microservices adoption level in organizations worldwide 2021.
4. Gartner — Microservices architecture: Adoption trends and engineering success.
5. Evoca TV — OTT Statistics and Global Market Share 2025.

