A helicopter view of the solution

  • Real-time data visualization
  • Actionable dashboards powered by Google’s Looker
  • Custom reports based on 200+ performance metrics
  • Granular access rights and customizable visibility rules
  • Integration with the client’s existing web application

Look at the whole business context from every angle

Pioneer in the digital media analytics sector

Our client helps advertisers, publishers, and marketplaces gain visibility into media performance and maximize return on digital ad investments.

The client’s flagship solution

The system provides media buyers and sellers with consistent data to assess campaign performance and optimize inventory quality.

Updates and experience requested

To keep bringing value to end customers by enabling deeper data granularity, optimized performance, and modern visualization, the client was looking for mature BI expertise to build an analytics platform for taking their SaaS solution to the next level.

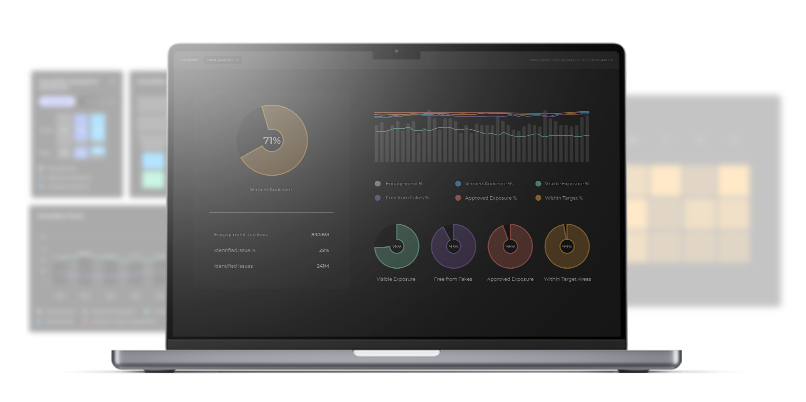
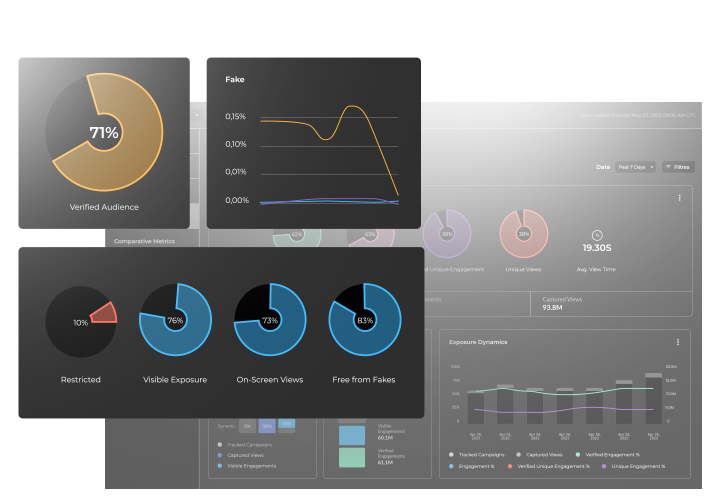
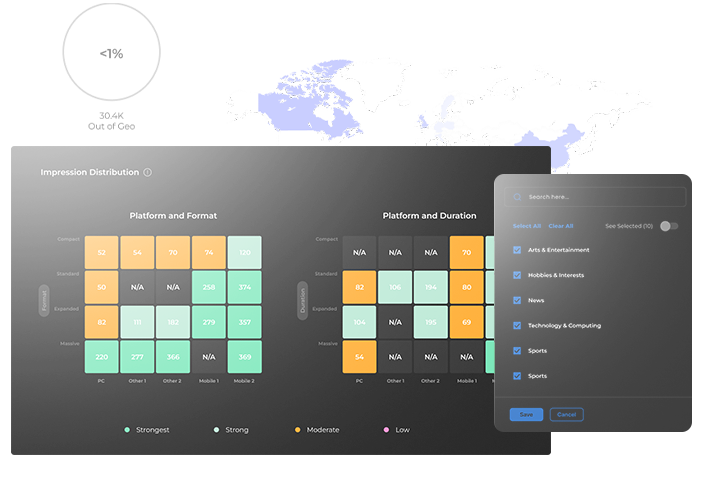
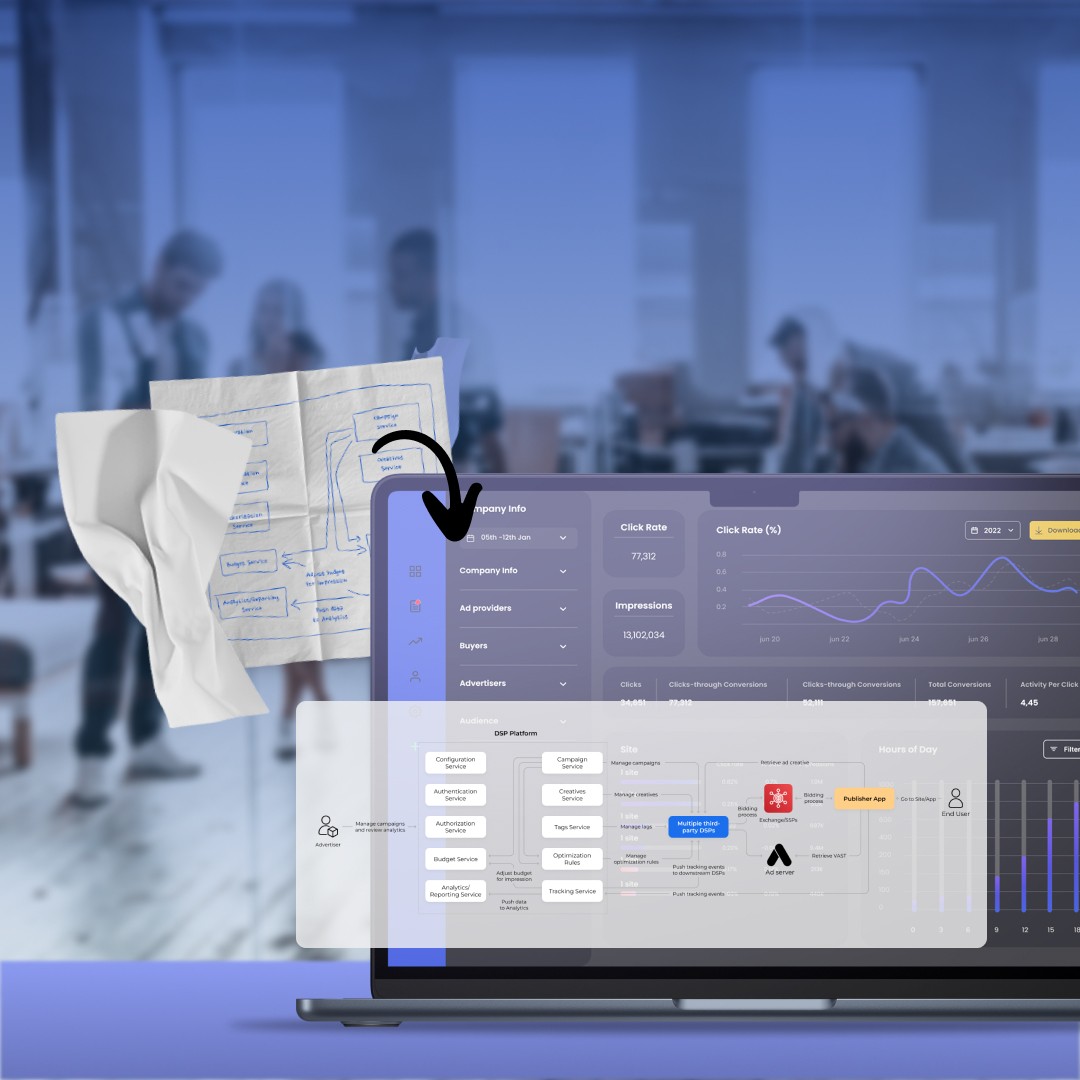
Сhallenges to address

  • Bringing all historic and real-time data under one roof
  • Ensuring scalability, efficiency, and reliability of the new platform
  • Implementing rich data visualization capabilities
  • Optimizing TCO, minimizing time to market for new functionality

Solution delivered: a single source of truth for informed decisions

Given the business-critical nature of the project, our team self-organized to work in parallel. While data engineers were building the ETL (Extract, Transform, Load) pipeline, BI engineers dived deep into the reporting part of the solution and custom visualization activities powered by JavaScript data visualization libraries.

ETL pipeline development
  • Legacy data migration
  • Complex multi-level SQL queries for business-specific logic
  • Data aggregation, storage, and transformation
  • Data clustering and parallel processing
Effective data visualization
  • Easy-to-interpret dashboards based on advanced Looker functionality
  • Granular access controls and visibility rules
  • Custom reports based on 200+ data points
  • Comparison against industry benchmarks
Cross-platform advertising campaign reports

With just a few clicks, users can filter campaigns by numerous parameters and easily access a snapshot of key performance metrics.

Custom dashboards for ads performance reporting

Our client’s solution integrates with major social media platforms (Facebook, LinkedIn, and a few more). Working with the client’s UX/UI team, Oxagile develops custom dashboards to visualize advertising campaign performance.

Do you have any big data needs?

Do you have any big data needs?

From providing data engineering services to crafting powerful data visualization solutions, we help companies discover actionable insights with up-to-the-minute analytics. Contact us with your specific needs, and we’ll get back to you with a tailored plan to unlock the power of data for your business.

Harnessing the full potential
of such tools as

Tools

Keeping the quality bar high with our expertise

Performance engineering

Making sure the solution meets strict SLA requirements was among our top priorities. Our engineers carried out a variety of strategically planned optimization activities that included:

  • Configuring and tuning cost-effective Snowflake autoscaling
  • Optimizing and prioritizing SQL queries to reduce latency and memory footprint
  • Implementing materialized views to decrease response time
  • Planning capacity for cloud services
  • Configuring virtual warehouses for continuous data loading

The numbers that highlight success

of the dashboards fire up in under 5 seconds

93%

of the dashboards come through in under 10 seconds

1,8

sec is an average request time

2,4

seconds is an average request time

“The results are extraordinary. Performance was our top concern, and it’s now eliminated. Thank you all for staying committed throughout this long journey! These results wouldn’t have been possible without our incredible teamwork and collaboration.”
— The client’s team representative

Handy, human-centered UI

With users in mind, we gave special priority to a fully modernized user interface and well-thought-out visual components. What was delivered:

  • Interactive UI elements: geographic heat maps, chart dimensions, filters, time ranges
  • Seamless navigation between dashboards
  • In-depth analysis powered by manifold metrics and dimensions
  • Higher granularity in data analysis
  • Time zone support
  • Near real-time analytics: hourly data refresh for the reports
  • Time period details: daily, weekly, monthly, yearly statistics

Business value: Reduced TCO with a scalable data analytics platform

Our deep expertise in Looker, an award-winning data platform from Google, was instrumental in helping the client eliminate dependency on costly third-party components while expanding the solution’s capabilities. The new solution seamlessly integrates with the existing web application and provides end customers with consistent and unbiased data around their marketing performance — all in an easy-to-understand and actionable way.

Let's talk business

Leverage our mature data intelligence expertise to build your own innovative BI solution and take the guesswork out of your decision-making.

Let's start talking!