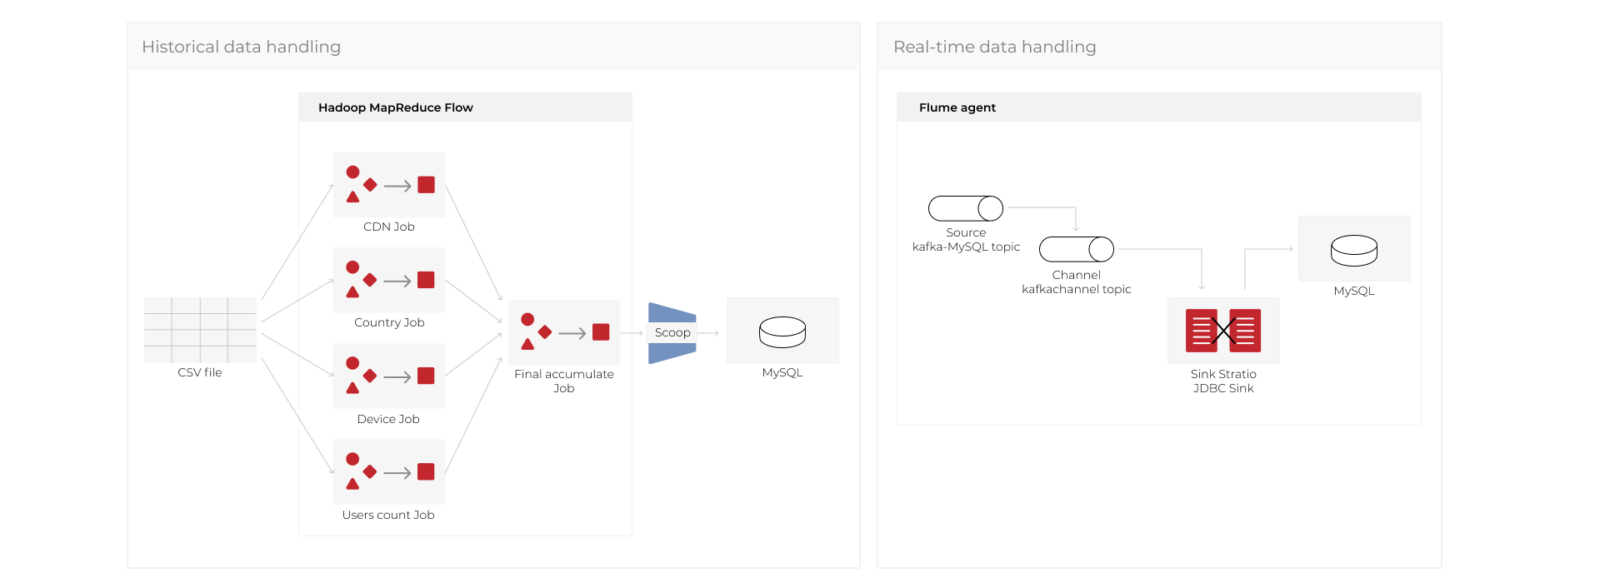
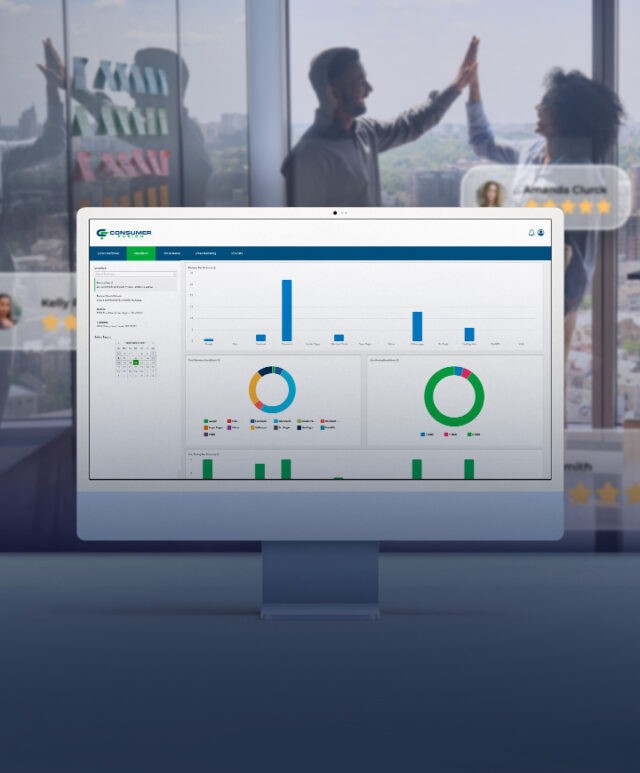
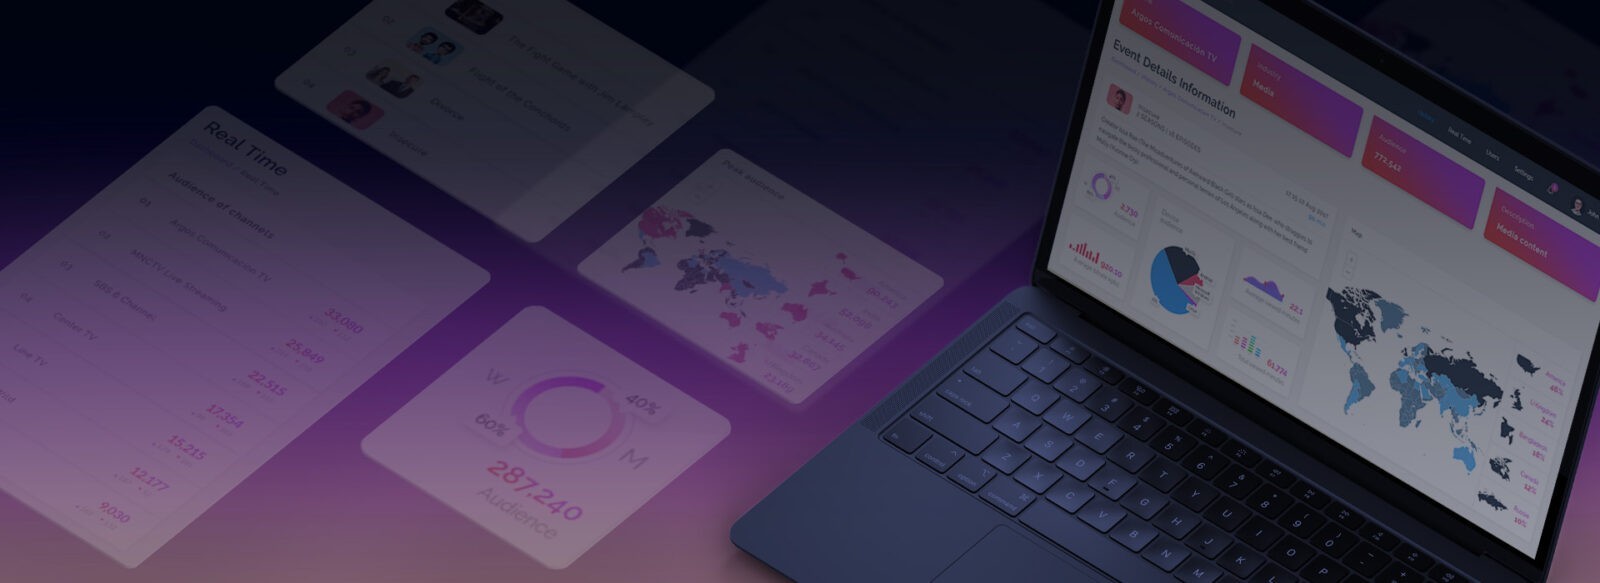
System at a glance

  • QoS/QoE monitoring solution
  • Scalable architecture to monitor an unlimited number of users
  • Historical and real-time statistics gathering
  • Meaningful visualization via a report generation module
  • All-round user behavior analysis
  • Audience distribution by CDN, country, device, and a number of users

Monitoring is needed to perfect the OTT solution

That was a request from a U.S.-based OTT TV platform owner. Having a global audience and specializing in sports and entertainment programming, the client never stopped working on video delivery pipeline enhancements and territorial expansion. To help the company succeed in two areas at once, Oxagile took on developing an OTT platform monitoring solution capable of processing two types of statistics. What for?

Historical + real-time statistics: better infrastructure and effective monetization gained

Both types of the statistics allow for a well-rounded user behavior and distribution analysis to generate targeted recommendations and provide ads most relevant to the specific needs or interests.

Well-rounded gathering of stats for:

  • Trending or viral video effective monetization
  • Covering new territories
  • Quick analysis and adaptation of video quality
  • OTT platform infrastructure analysis
  • Getting insights on the critical nodes
  • Identifying and fixing performance issues

Architecture ready for millions of database records and an unlimited number of users

Quick processing, meaningful reporting

Visualization matters as a structured picture assists the client with making data-driven business decisions. What has been done in this field?

  • A report generation module to evaluate every business aspect and spot emerging trends for effective fund allocation
  • Intuitive dashboards showing the number and location of concurrent users, top-rated programs, quality of service metrics for multiple live streams, etc.

Harnessing big data powers for big revenue

The insights provided by our online video monitoring system after the analysis of TV channels, programs, and audience distribution (CDN, country, device, and a number of users) helped the client choose the right multi-CDN strategy. The figures demonstrate that the course is right:


Months after the launch of the monitoring solution


Cost reduction via a multi-CDN strategy


CTR boost thanks to segmented ad campaigns

Delivery Model
SLA-driven task backlog delivery (TM-based)
Effort and Duration
6 months, 30 man-months
Technologies
Java, Spring, Hibernate, Apache Hadoop, Apache Kafka, MapReduce, MySQL, HTML5, CSS3, jQuery, Bootstrap