We all know page speed is important — both in terms of SEO and user experience.
A slow site also means lost customers. In 2010, Akamai and Gomez found that 47% of consumers expect a page load time of two seconds or less, while 40% abandon a page that takes over three seconds to load. The expectations are no doubt even higher in 2016 (think one second loading time).
Luckily, Google offers a powerful tool called PageSpeed Insights (PSI) that lets you speed-test any URL on a scale of one to 100 and identify bottlenecks to fix.
Once you’ve optimized your pages, speed-testing needs to be done every time your codebase changes — whether it’s adding new CSS files or installing a WordPress plugin that loads a ton of JavaScript that bogs you down.
A single URL can be tested by hand, but manually checking 20 important landing pages every time something changes will quickly become a burden.
In this article, we will go through the process of creating a custom script that will allow us to easily speed-test an entire staging site (or a set of key pages) before pushing it to production — in a completely transparent and automated manner.
This way, you can catch any speed regressions before they go live and make performance-testing part of your web development culture.
How It Works
Here is a rough breakdown of what the script will do:
- set up a secure tunnel to expose your staging site to the world (this is because the PSI service only works with publicly accessible URLs);
- programmatically walk through a local domain and create a list of valid URLs for testing;
- speed-test every URL in the list;
- create a nice HTML report and send it to a predefined address;
- lay the groundwork for generating test reports for use with Jenkins (for conciseness, the implementation is left as an exercise to the reader).
Below is a screenshot of a sample HTML email produced by the script: 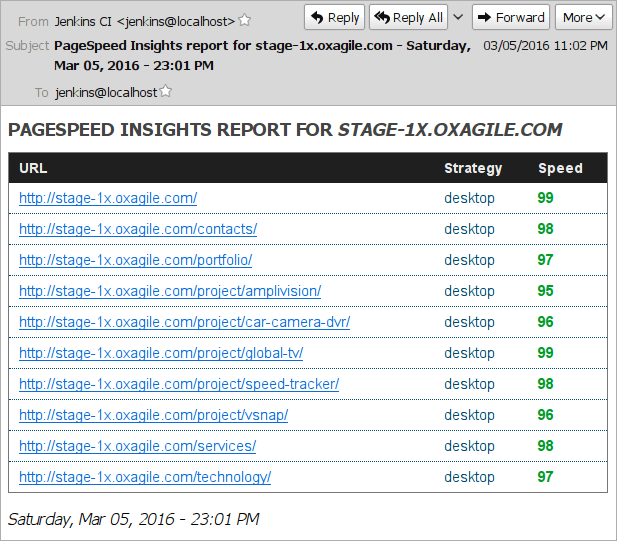
Requirements
- a Linux box with a recent version of
bash (we will use Debian Jessie); - intermediate to advanced shell scripting skills (including familiarity with
bash arrays and regular expressions); - working knowledge of HTML and experience with mustache templates for reporting.
Getting Ready
We will rely on several CLI tools to achieve our end:
-
wget and curl to spider a website and prepare a list of URLs for testing; - ngrok to securely expose a staging site to public internet;
- the excellent
psi Node.js module by Google to run the tests; -
jq to easily parse JSON output in bash; - mustache.js to generate HTML reports in an elegant way.
First, let’s create our project directory structure:
tree ~/code/01-bash-psi-site-automation
├── tmpl           # the mustache templates go here
└── psi-test.sh    # this is our main script
Now let’s go ahead and install everything with a few simple commands:
apt-get install wget curl jq nodejs npm
npm install -g psi      # install PSI CLI tool
npm install -g mustache # install mustache.js
Download ngrok from the project’s download page, unzip the binary, and move it somewhere in your $PATH.
Let’s Do It!
Open the main script file in your favorite editor, and let’s get started.
Step 1: Setting the variables
First, let’s declare some variables we will need:
# declare variables:
domain="stage-1x.example.org" # staging site
threshold="90" # minimum score for URL to pass the test
ngrok_log_file=$(mktemp -t ngrok_log.XXXX)
mailto="someguy@example.org" # mail recipient

# user agent for wget and curl:
ua="Mozilla/5.0 (Windows NT 6.1; WOW64; rv:40.0) Gecko/20100101 Firefox/40.1"

# some temp files we'll use:
wget_urls_file=$(mktemp -t wget_urls.XXXX)
curl_urls_file=$(mktemp -t curl_urls.XXXX)
json_data_file=$(mktemp -t json_data.XXXX) # data view for mustache

# report output file:
html_report_file=$(mktemp -t psi_report.XXXX)

report_date="$(date +'%A, %b %d, %Y - %H:%M %p')"
report_title="PageSpeed Insights report for $domain - $report_date"
Step 2: Starting the tunnel
# start a new tunnel:
ngrok http 80 \
    --host-header "$domain" \
    --log "$ngrok_log_file" \
    --log-format "json" \
    --log-level "debug" >/dev/null &

sleep 5 # give the tunnel some time to start up
ngrok will now create a new tunnel, which by default will be a random subdomain on ngrok.io, such as http://3f526933.ngrok.io. You can also get a paid plan, which will give you a custom fixed subdomain for testing. If that is your case, simply pass the --subdomain option.
Otherwise, use a simple combination of jq and grep to get the randomly assigned host name from the log file. The host name is stored in a JSON object called opts:
ngrok_host=$(jq '.opts' < "$ngrok_log_file" | \
        grep '\.ngrok\.io' | \
        cut -d ':' -f2 | \
        cut -d ' ' -f1)

# validate host and die early if there's a problem:
if [[ $ngrok_host =~ ^[a-z0-9]+.ngrok.io$ ]]
    then echo "Tunnel is up, host is '${ngrok_host}'."
    else { echo "Invalid host '${ngrok_host}'."; exit 1; }
fi
Step 3: Getting the URLs for testing
Let’s get the initial list of URLs with a tried-and-true tool, wget:
# spider the domain and get the URLs:
wget \
    --user-agent "$ua" \
    -S --spider \
    --force-html \
    -R png,jpg,jpeg,ico,css,js \
    -r -l5 -nd --delete-after \
    -e "robots=off" \
    "http://${domain}" 2>&1 | \
        grep '^--' | awk '{print $NF}' | \
        sed 's/\/$//' | sort | uniq > "$wget_urls_file"
Several things to note here:
- we are not interested in
*.js, *.css or image files, so we exclude them with the -R option; - the
-l5 option specifies the level of recursion, i.e. how deep the spider will crawl the domain; - our staging site has a
robots.txt that blocks all spiders, hence the -e "robots=off" option; -
wget outputs to stderr, so to grep the output we redirect it with 2>&1.
Next, let’s make sure all the URLs are good, i.e. return a 200 response. After all, it makes no sense to speed-test pages that give you a 403 or 404. We also need to exclude local 30x redirects, as they will fail with PSI.
With curl, validating server response codes is easy:
# only keep URLs that return a 200 response:
mapfile wget_urls < "$wget_urls_file"
for url in "${wget_urls[@]}" ; do
    curl -A "$ua" -s -L -o /dev/null \
        -w "%{http_code} %{url_effective}\n" "$url"
done | grep '^200' | awk '{print $2}' | sort | uniq > "$curl_urls_file"
Note the -L option. It instructs curl to obey the Location header in 30x redirects and follow the redirect till it gets the end URL. This ensures PSI won’t try to test tunneled pages that redirect to your staging server it can’t access anyway.
Now that we have a neat list of good URLs, simply replace the staging domain name with your ngrok tunnel name and we can start the tests:
# replace our domain with ngrok's host:
sed -r "s|$domain|$ngrok_host|" -i "$curl_urls_file"
Step 4: Speed-testing
Let’s iterate through our list of URLs and pass them to psi for testing:
# array for URLs to be tested:
mapfile -t psi_data < "$curl_urls_file"

n=0
echo '{ "psi-data": [' > "$json_data_file" # start writing JSON data for mustache
for u in "${psi_data[@]}" ; do
    status="error"
    score=""
    n=$(expr $n + 1)
    echo "Running tests for '$u'..."

    score=$(psi "$u" --threshold=$threshold --strategy=desktop --format=json | \
        jq '.overview' | jq '.Speed' --raw-output -c)
    if [[ $score =~ ^[0-9]+$ ]] ; then
        if [[ $score -ge 90 ]] ; then
            status="high"
        elif [[ $score -ge 70 ]] ; then
            status="medium"
        else
            status="low"
        fi
    else
        score=0
    fi
    data="{ \"url\": \"${u}\", \"score\": ${score}, \"status\": \"${status}\" }"
    [[ ${#psi_data[@]} -gt $n ]] && data+=","
    echo "$data" >> "$json_data_file"
done
# finish writing JSON data:
echo "]," >> "$json_data_file"
echo " \"domain\": \"${domain}\", \"report_date\": \"${report_date}\", \"report_title\": \"${report_title}\" " >> "$json_data_file"
echo "}" >> "$json_data_file"
The code should be pretty straightforward, but basically what we do here is this:
- call the
psi tool on every URL and grab test results in JSON format; - parse the JSON data with
jq and store the speed score in a variable; - do some error checking: if
psi returns empty or invalid data, the report will contain an error message; - write a standard JSON data view file for
mustache, so we easily can generate our reports.
The JSON data file should now look something like this:
{
  "psi-data": [
    {
      "url": "http://f6ee298f.ngrok.io/",
      "score": 97,
      "status": "high"
    },
    {
      "url": "http://f6ee298f.ngrok.io/portfolio/",
      "score": 92,
      "status": "high"
    }
  ],
  "domain": "stage-1x.oxagile.com",
  "report_date": "Tuesday, Mar 8, 2016 - 23:00 PM",
  "report_title": "PageSpeed Insights report for stage-1x.oxagile.com - Tuesday, Mar 8, 2016 - 23:00 PM"
}
Step 5: Generating our report
If you are not familiar with mustache, it is a logic-less template system that makes it easy to separate logic from presentation. For an in-depth understanding, check out the mustache manual.
For the purpose of this article, let’s create a simple template.html file in the tmpl directory we made earlier and put the following markup in it:
<!doctype html>
<html>
<head>
    <meta charset="utf-8">
    <title>PageSpeed Insights report for {{domain}} - {{report_date}}</title>
    <meta name="viewport" content="width=device-width, initial-scale=1">
    <style type="text/css">
    /* put your styles here */
    </style>
</head>
<body>
    <h1>PageSpeed Insights report for <em>{{domain}}</em></h1>
    <table>
        <thead>
            <tr>
                <th>URL</th>
                <th>Strategy</th>
                <th>Speed</th>
            </tr>
        </thead>
        <tbody>
        {{#psi-data}}
            <tr><td><a href="{{& url}}">{{& url}}</a></td><td>desktop</td><td><span class="{{status}}">{{score}}</span></td></tr>
        {{/psi-data}}
        </tbody>
    </table>
    <p class="date">{{report_date}}</p>
</body>
</html>
The placeholders inside double curly braces ({{ and }}) will be populated with the JSON objects from our data view file. The {{#psi-data}} placeholder is a list corresponding to the psi-data array.
Let’s go ahead and call mustache to generate the report:
# generate report using a mustache template:
mustache "$json_data_file" ./tmpl/template.html > "$html_report_file"
The report still contains the randomly assigned ngrok host name, so let’s fix that:
# replace ngrok's host with our domain:
sed -r "s|$ngrok_host|$domain|g" -i "$html_report_file
Step 6: Send email
Sending mail is trivial using standard Linux tools:
echo "Sending mail..."
mail -a 'Content-Type: text/html; charset="utf-8"' \
    -s "$report_title" "$mailto" < "$html_report_file"
Note that for the HTML email we are adding an extra header with the -a option to specify the correct content type.
Step 7: Cleaning up
Always a good practice to take out the trash:
echo "Cleaning up..."
rm -f "$ngrok_log_file" "$wget_urls_file" \
    "$curl_urls_file" "$html_report_file" "$json_data_file"
killall ngrok
Final Thoughts
And there you go — we have just created a custom system that enables us to speed-test any set of pages with Google PageSpeed Insights. It’s all fully automated, including URL harvesting and validation.
Integrate the script into your Jenkins workflow to run it as a nightly job or trigger it when someone pushes new code into your git repository.
You will get a nice email that will provide visibility into how fast your key pages are loading so you can take action early.
Because the script’s logic is completely separate from presentation, building other reports (think JUnit XML) from the same JSON data becomes a no-brainer. JUnit reports are easy to integrate with Jenkins, allowing you to view tests visually and track page speed over time: 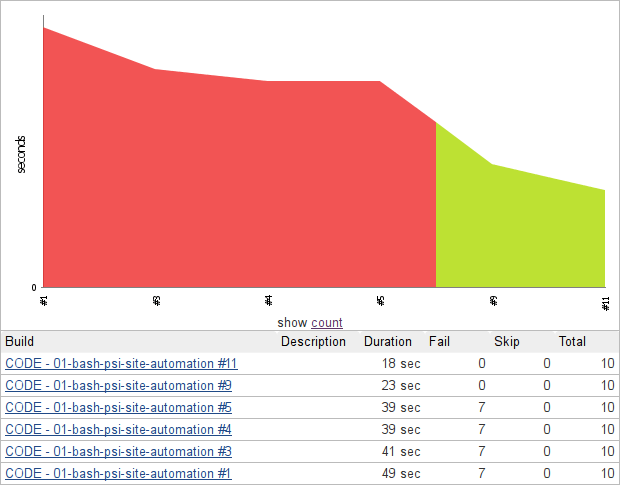
References:
-
psi — PageSpeed Insights with reporting -
ngrok FAQ — https://ngrok.com/faq - the excellent
wget manual — https://www.gnu.org/software/wget/manual/wget.html -
jq — lightweight and flexible command-line JSON processor -
mustache — logic-less templates